Skip to main content
Help! I can’t close the Power BI Desktop Splash Screen!
"The target location you specified is not supported by the report server" message when configuring SSRS in SharePoint Integrated mode
Client kept getting "The target location you specified is not supported by the report server" message every time they try to run a SQL 2005 report manually deployed to SharePoint document library (MOSS). This same error also showed up when we go to "Set Server Defaults" (in the top section) page in Central Admin .
This same report worked fine when a subscription is enabled and the subscription runs in un-attended mode.
Within "Manage Integrated settings" page, the authentication mode is set to "trusted account" as Kerberos is not enabled.
The cause for this message was because there was another Alternate Access Mapping (AAM) set up for Central Admin.
Once the extra AAM was removed, the error disappeared and issue was resolved.
Here is the link that helped resolve this issue https://forums.microsoft.com/MSDN/ShowPost.aspx?PostID=2991956&SiteID=1
Per Shawn Feldman (a colleague of mine), the reason for this is due to Reporting Services in SharePoint Integration mode does not support multiple zones. That's why it errors out when one has a second AAM.
When trying to build an OLAP cube, we kept getting "Your permissions on the server computer do not allow you to administer this analysis server".
Technologies involved
Project Server 2007 (SP1, Infrastructure Update)
SQL Server 2005 SP2
Issue
When trying to build an OLAP cube, we kept getting "Your permissions on the server computer do not allow you to administer this analysis server".
In our environment, we wanted to configure Analysis Services to use SQL DB, not Jet database.
After ensuring the security permissions and related steps (https://technet.microsoft.com/en-us/library/cc197489.aspx), we still kept getting this issue.
Turns out that the error message "Your permissions on the server computer do not allow you to administer this analysis server" is a catch all message and the final resolution turns out to be a poorly documented step.
Resolution
It is very important to ensure that all security settings have been applied as documented within https://technet.microsoft.com/en-us/library/cc197489.aspx (especially verifying that ssp service login can access the Analysis services)
If you still keep getting this message, the most likely cause is the missing additional steps listed below.
Note: This is just valid for Analysis services repository residing in SQL database (not Jet database)
- Follow the steps listed below (copied from https://technet.microsoft.com/en-us/library/cc197552.aspx)
Create a shared folder for the repository
You must create a shared folder in SQL Server 2005 Analysis Services where the repository will be located. You also must make the shared folder accessible to accounts that will need to access it.
![]()
Create the shared folder
1. In Windows Explorer, browse to the folder containing the Analysis Services installation. By default, it is located at: C:\Program Files\Microsoft SQL Server\MSSQL.X\OLAP
2. In this folder, create a new folder and name it DSO9.
![]()
Note
If the subfolder MSSQL.2\OLAP does not exist, use the \OLAP folder in one of the MSSQL.X subdirectories.
3. Right-click the DSO9 folder, and choose Sharing and Security.
4. On the Sharing and Security page, in the Sharing tab, select Share this folder. In the Share Name box, type MSOLAPRepository$ as the share name for the folder.
5. In the Security tab, in the Group or user names list, select SQLServer2005MSOLAPUser$SERVERNAME$MSSQLSERVER. Select the Allow check box next to the Full Control item in the Permissions list, and then click OK.
6. Click Add. On the Select Users, Computers, or Group page add the account running the Project Server Queue service on the Project Server application server. Click OK.
![]()
Note
To verify this account, on the Project Server application server, click the Start menu, click Programs, click Administrative Tools, and then click Services. Double-click Microsoft Office Project Server Queue Service and note the account on the Log On tab.
7. In the New Folder Properties page, click OK.
- For MSOLAPRepository$ share, please ensure that SSP service login also has full control over the share
- Within In addition to DSO\RemoteRepositoryConnectionString as well as DSO\RepositoryConnectionString (Configure Analysis Services to use a SQL Server repository database Pasted from <https://technet.microsoft.com/en-us/library/cc197552.aspx> ) also fill in values DSO\RemoteLockDirectory (for e.g. set it to "\\AS_Server_Name\MSOLAPRepository$") and DSO\LocksDirectory (for e.g. set it to "C:\Program Files\Microsoft SQL Server\MSSQL.X\OLAP\DSO9)
Hopefully after performing the above 3 steps, you should be able to build the cube.
Hello world!
Welcome to Developer Network. This is your first post. Edit or delete it, then start blogging!
Calculating the difference between two dates in YEARS, MONTHS, and DAYS in Power BI or Excel
How do I calculate an employee's tenure given their start date?
How can I determine a person's age given their birth date?
In a customer conversation this week, I was asked to help solve this question in Power BI. Interestingly, I was intrigued by this topic almost 5 years ago when I wrote a blog entry to solve this in TSQL, but now it is time to solve it in DAX for use in Excel or Power BI. The challenge with this question is that it sounds so simple, yet turns out to be a bit tricky. There are likely several other creative ways to solve this. If you have found another way, please share it in the comments below.
Let's start with a list of employees and their start dates:
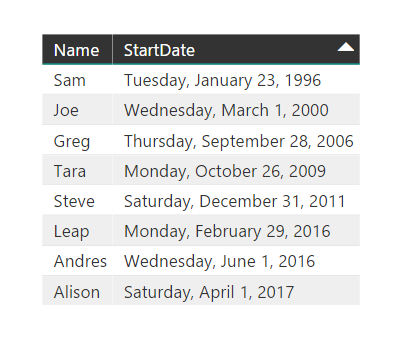
Now create a measure to represent today's date (or whatever date you want to use as the end date for the calculation).
TodaysDate = FORMAT(TODAY(),"mm/dd/yyyy")
I am using YEARFRAC as the basis of the year/month/day calculations. YEARFRAC returns the number of years in a fractional format between two dates. From this value, we can use additional math functions, such as FLOOR() and MOD() to break out the individual year/month/day components.
Create the following columns in Power BI (or formulas in Excel):
Years = FLOOR(YEARFRAC(Source[StartDate],[TodaysDate]),1)
Months = FLOOR(MOD(YEARFRAC(Source[StartDate],[TodaysDate]),1) * 12.0,1)
Days = SWITCH(DAY(Source[StartDate]) > DAY([TodaysDate]),
TRUE(), (DAY(EOMONTH([TodaysDate],-1)) - DAY(Source[StartDate])) + (DAY([TodaysDate])),
FALSE(), (DAY([TodaysDate])-DAY(Source[StartDate])))
Using these calculations, we can display the date difference in years, months, and days:
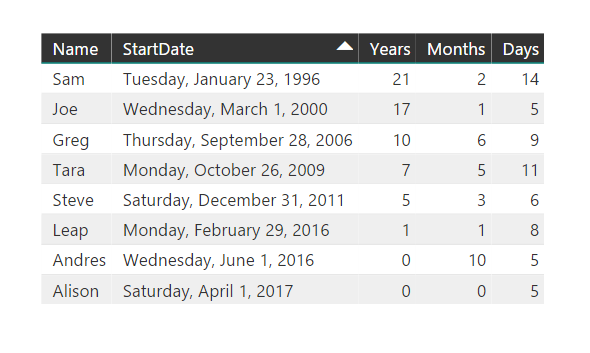
The sample .pbix file can be downloaded here to explore on your own.
Thanks,
Sam Lester (MSFT)
Comparing Table Styles in Power BI
Tip: Use table styles to improve the look of your table data in Power BI
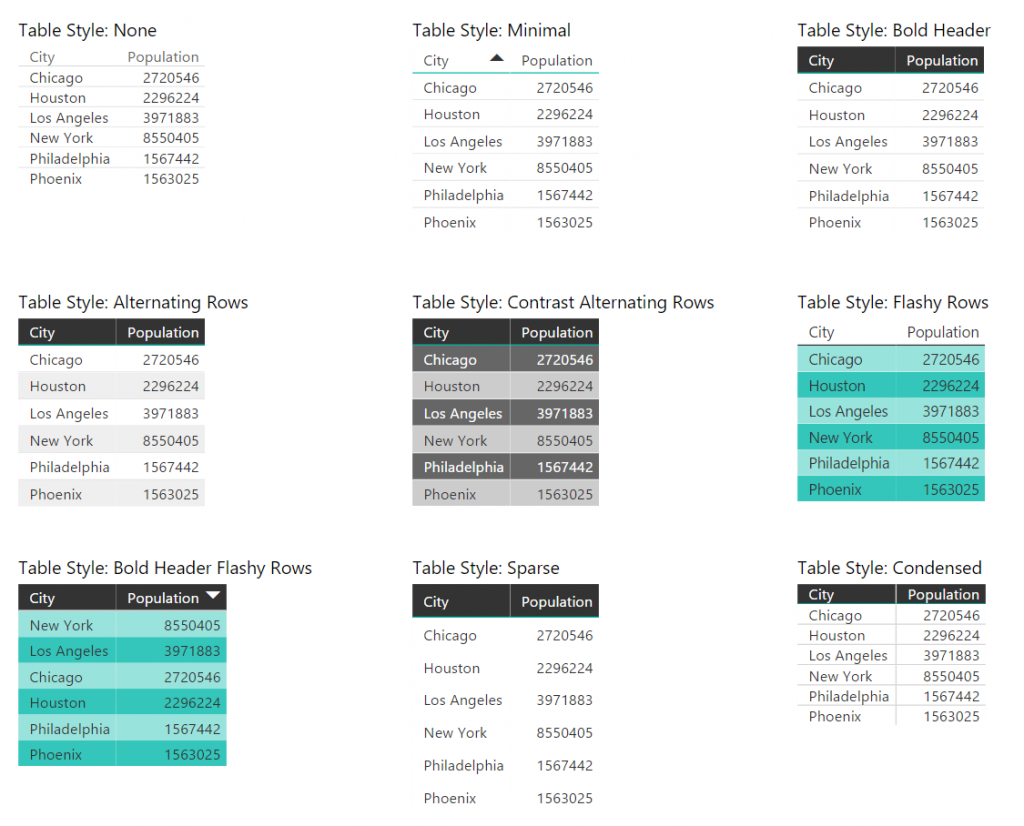
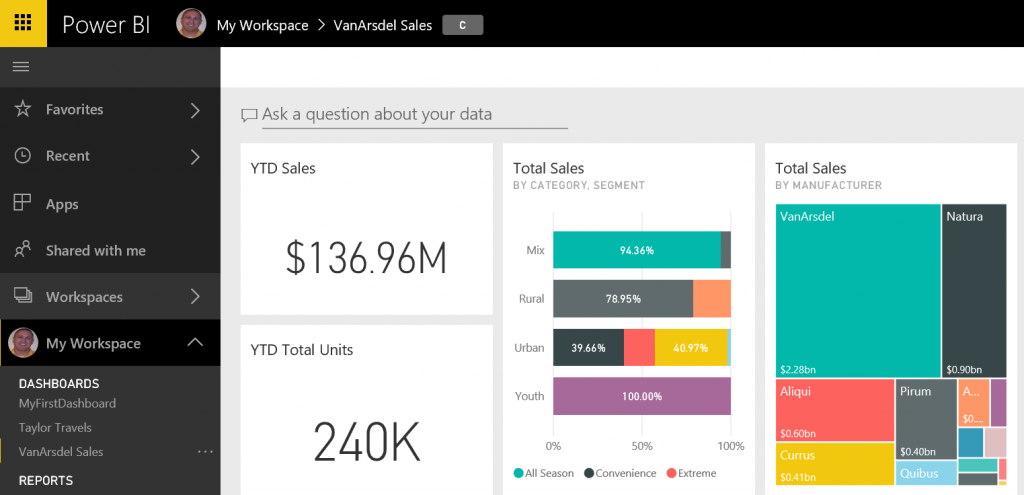
As I continue to work with customers who are new to Power BI, a common pattern I'm noticing is that people aren't aware of the table style option in the format pane. The following screen shot shows the 9 different options, all in 10 point font to get a quick comparison on the look and the amount of space each option requires. These all use the default color scheme, but the colors can be modified.
I tend to use the Alternating Rows style or the Condensed style depending on the amount of space I have to work with, but it's just a preference. Feel free to comment on which style you prefer.
Thanks,
Sam Lester (MSFT)
Connecting to SSRS through Management Studio throws "Invalid Namespace" Error
When connecting to a SQL Server Reporting Services instance through Management Studio, I encountered the following error:
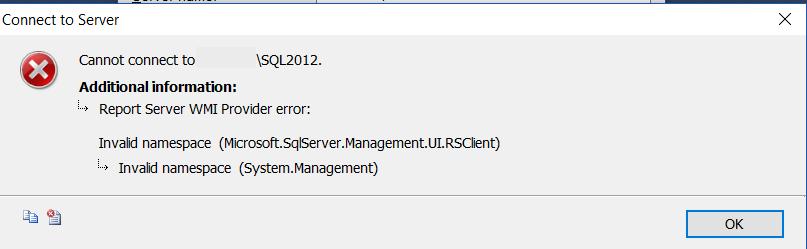
Report Server WMI Provider error:
Invalid namespace (Microsoft.SqlServer.Management.UI.RSClient)
It turns out that I was trying to connect to SSRS 2012 through SQL Server Management Studio 2014. Once I launched SSMS 2012, I was able to connect successfully, so it was a simple resolution to a somewhat confusing WMI provider error message.
Thanks,
Sam Lester (MSFT)
Creating a New Project in Visual Studio fails when FIPS is enabled
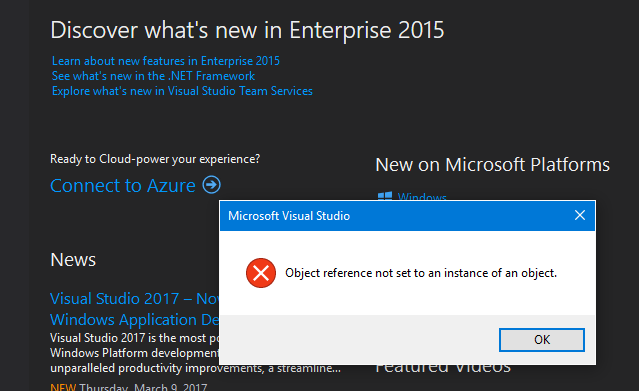
While testing application compatibility on Windows 10, one of my customers encountered an issue creating a new project in Visual Studio 2015 when FIPS was enabled. A new project could be completed successfully one time, but all future attempts to create a new project failed with an error message stating "Object reference not set to an instance of an object".
We isolated the issue to the FIPS security hardening requirement included as part of the Windows 10 Security Technical Implementation Guideline. For additional details, see the following link:
https://www.stigviewer.com/stig/windows_10/2016-06-24/finding/V-63811
With this information, we then worked with the Visual Studio product group to collect trace/stack information, and the developer was able to isolate the problem to a known issue in the "Application Insights for Visual Studio" extension. The bug has already been fixed, which allowed us to perform the following steps to resolve the issue on our development machine:
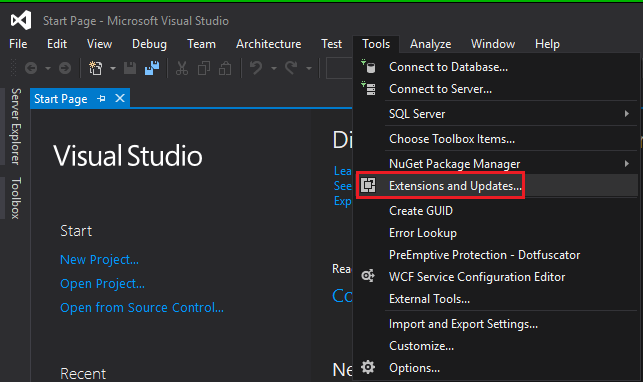
- Uninstall the "Application Insights for Visual Studio" extension through Tools -> Extensions and Updates. Since the code path that is causing the issue is in this extension, removing the extension made the problem go away. NOTE: This must be uninstalled with an elevated account. Many enterprises do not allow "normal users" to have administrative rights on their machines, so this uninstall will require additional elevated privileges.
- (Optional) Reinstall the "Application Insights for Visual Studio" extension. When you reinstall the extension, you get the latest version of the code, which includes the fix. If you aren't using the extension, you do not need to reinstall it. However, if you are using the extension, you can reinstall it without reintroducing the issue on your machine.
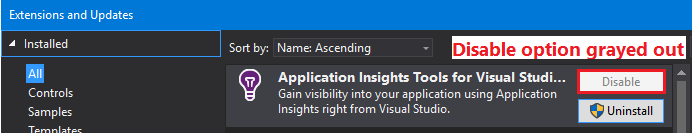
Without elevated privileges, the disable button is grayed out and the uninstall does not successfully uninstall the extension.
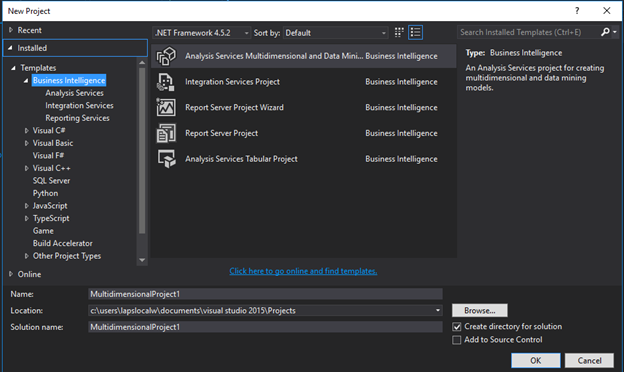
Running in elevated mode allows you to uninstall the extension. Restart Visual Studio to see the change and you are able to create new projects again successfully.
Special thanks to the amazing Joie Andrew, John Gardner, and Bertan Aygun for the great assistance on identifying, analyzing, and testing the scenario and solution.
Thanks,
Sam Lester (MSFT)
Additional note: If you are working in an environment that requires FIPS to be enabled, we also identified a FIPS related bug in Power BI Desktop that has now been fixed.
Excel Add-In not displayed in ribbon due to Group Policy setting
Excel Add-In not displayed in ribbon due to Group Policy setting
Problem: The Excel Solver Add-in is enabled and appears to load during startup, but is not displayed/visible in the ribbon.
Solution: Update the Group Policy setting titled "Disable UI extending from documents and templates" to uncheck/disable "Disallow in Excel".
Details:
Today I encountered another interesting customer environment setting that caused unusual behavior in our software, this time with Excel. I received a question from a data analyst who was trying to use the Solver Add-In in Excel 2013, but no matter what he tried, the Solver button would not get displayed in the Data ribbon. We enabled the Solver Add-in and saw the message during startup that the add-in was being loaded, but it was not visible in the toolbar ribbon. The following screenshot shows it being loaded during startup.
After scouring several online threads and blog entries, we finally isolated the issue down to a specific GPO Group Policy setting, thanks to outstanding support from fellow Microsoft colleagues Jacob Heaton, Justin Abel, and Karl Camacho.
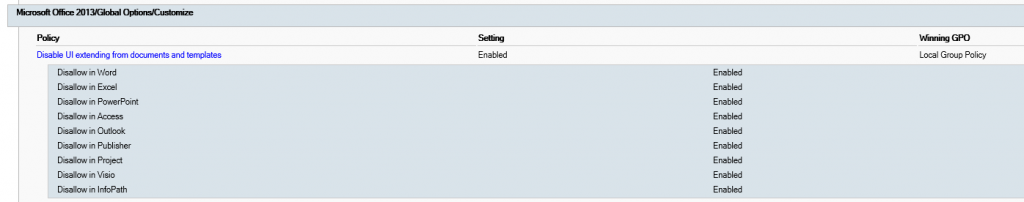
From gpresult output:
To update the GPO setting that is preventing the button from being added:
- Launch gpedit.msc
- Navigate to User Configuration -> Administrative Templates -> Microsoft Office 2013 -> Global Options -> Customize -> Disable UI Extending from documents and templates.
- Uncheck "Disallow in Excel"
- Close gpedit
- Run "gpupdate /force" to update the change on the local machine
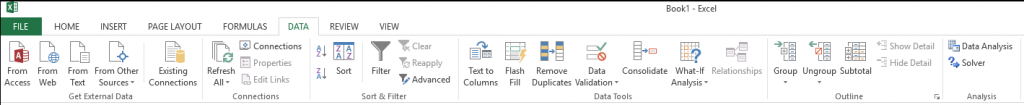
- Launch Excel and verify that the Solver add-in is displayed in the Data -> Analysis ribbon
Thanks,
Sam Lester (MSFT)
Exploring Big Data: Course 1 – Microsoft Professional Orientation: Big Data

(This is part 1 of my review of the Microsoft Professional Program in Big Data)
Overview: Titled as the Big Data orientation, the course does just that as it gives a great overview of several key concepts. I really liked digging into CosmosDB to learn more about the difference between Key/Value pair, Document DB, and Graph DB. The batch and real-time processing in HDInsight videos were also really good as an overview. One benefit for me was to have this all set up in my Azure lab within a few hours so that I can continue to play around with it after the course wraps up.
Time Spent / Level of Effort: From my previous Data Science MPP experience, the orientation course is the shortest course and easiest to complete. I completed this course in roughly 3.5 hours.
Course Highlight: The CosmosDB lab was my favorite hands-on work since it was so easy to set up and explore the different options (Document, Graph, and Key-Value), including a side distraction where I branched off to learn more about graph traversal in Gremlin. My favorite video was the "Introduction to Big Data Technologies" where Graeme Malcolm starts with a simple data flow and ends up explaining numerous Azure technologies that comprise this scenario. 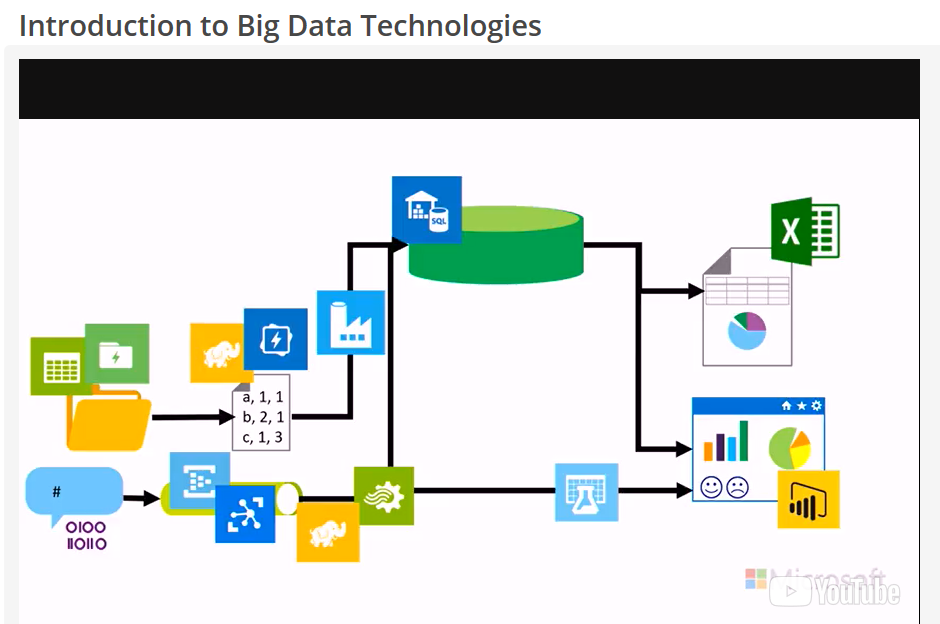
Suggestions: I've found that I can watch the videos in playback speed x2 and still understand them very well. I also open the quiz questions in another browser tab prior to watching the videos. As the video content approaches the content of the quiz questions, I slow down the video speed and listen for the quiz topics. This has helped get through the labs with 100% success rate in nearly all my courses.
If you have taken this course in the past or are going through it now, please leave a comment and share your experience.
Thanks,
Sam Lester (MSFT)
Exploring Big Data: Course 10 – Microsoft Professional Capstone: Big Data
(This is course #10 of my review of the Microsoft Professional Program in Big Data)
Overview: Course #10 brings the Microsoft Professional Program in Big Data to a close. The capstone project is comprised of three different sections, each making up 33% of the overall grade even though the complexity and number of questions varies by section. The project is based on one years' worth of weekly sales data for roughly 300 stores making the dataset a collection of over 15,000 files. As a result, we need to rely on the techniques learned in previous courses to set up blob storage, use Azure Storage Explorer to copy/store files, author U-SQL jobs to process files, set up the data warehouse using the supplied T-SQL script, create linked services to establish the dataset connections and pipelines, and finally load the data into the data warehouse to query for the final answers.
Time Spent / Level of Effort: When I read the first lab exercise instructions, I was a bit nervous about tackling this project. Over the previous nine courses, we've covered a LOT of material, much of which is challenging to keep straight. I had completed the 9th course about two weeks before the capstone opened, so I went back to the previous archived capstone and spent about 12 hours going through the old capstone to practice. As it turned out, this was time very well spent. In total I spent roughly 15 hours for this capstone project.
Course Highlight: The highlight of the capstone course was going from reading the original instructions with a hefty dose of confusion to ultimately completing the labs and projects to wrap up the class. It required me going back through several of the previous courses and reading the lab instructions and watching some videos for a second and third time.
Suggestions: My biggest suggestion for completing the capstone course is to view the previous capstone course to better understand the tasks. For example, I officially completed the capstone course that opened on January 1, 2018, but I spent several hours working on the previous capstone (October 2017). The time I spent on the October course was extremely helpful when the new course opened since I had already completed most of the exercises.
An additional suggestion would be to focus on obtaining the required passing score of 70% prior to the second part of lab 3, where all 15,000+ files need to be loaded and queried. I found this part of the course to be the most challenging, but since I had already scored above 70%, I wasn't as concerned about getting these questions correct. However, if I'd been below the required 70% at this point, there would have been a lot more pressure to get these questions correct.
Finally, use the tips supplied in the lab exercise notes that inform you of the courses where the material was originally introduced. As mentioned above, much of the material overlaps a bit, so knowing which course to revisit saved a lot of time. Once I went back to the specific courses for review, I found the lab instructions for those courses to be extremely helpful.
Summary: The 10 courses that make up the Microsoft Professional Program in Big Data are an outstanding way to improve your knowledge about the concepts of processing Big Data. Prior to completing this MPP, several of these topics were vaguely familiar to me, but not well enough to teach/explain to others. After going through this program, I have a much better understanding and will continue to work with these technologies.
I hope this blog series has helped you on your journey to improve your Big Data skills. It certainly has helped mine!
Thanks,
Sam Lester (MSFT)
Exploring Big Data: Course 2 - Analyzing and Visualizing Data with Power BI
(This is course #2 of my review of the Microsoft Professional Program in Big Data)
Foreword: For the Analyzing and Visualizing Power BI course, I have asked my outstanding colleague Steve Taylor to share his experience recently completing the course. I originally took this course for the first time in December 2015 and since that time have worked almost exclusively with Power BI on customer sites. Steve and I thought that his perspective coming from a platforms background and being newer to Power BI would be a nice addition to the series.
Introduction : My name is Steve Taylor and I'm a Platforms PFE with Microsoft, who is pursuing data science as my IT side-hustle. Sam has asked me to review the two courses (Power BI and TSQL) that overlap between the MPP for Big Data and the MPP for Data Science, as I've taken both courses more recently than Sam's pilot experience in the Data Science program. Given that I'm just breaking into the data side of things, I'll bring a beginner's perspective to these two courses.
Overview : The course consists of ten modules, eight of which contain knowledge checks and labs. The syllabus walks you through using Power BI to connect to data, transform data, create models, and visualize the results. From there you start to use Power BI Desktop to interact with the Power BI service and use existing data models in Excel, Azure SQL, SQL Server Analysis Service, and other sources.
Time Spent / Level of Effort : Since I am pretty new to Power BI, this course took me about 7-8 hours to complete. There are just over 6 hours worth of videos in the course (when watched at 1.0x speed) and the remaining time was spent on the knowledge checks and labs. If you are already familiar with Power BI and Data Analysis Expressions (DAX), you could zip through the videos/quizzes/labs in a couple of hours.
Course Highlight : For someone who knew nothing more than "data visualization, right?" about Power BI, I found this course was a great overview of the breadth of possibilities within the tool. The course gave me just enough information about Power BI, DAX, and Power Query M that I'm confident enough to start trying to model and visualize more data sets, even if I know just enough to be dangerous and have to spend a lot of time on MSDN to get it just right.
Suggestions : For these edX courses, I look ahead to the data sets provided and try to follow along with the presenters in the videos (easier done when played at 1.0x speed). With both the videos and the labs, I found I was able to discover some Power BI features and capabilities by playing around with the data and visuals beyond what was discussed/asked for in the course specifically.
If you have taken this course in the past or are going through it now, please leave a comment and share your experience.
Many thanks to Steve for sharing his review of the Power BI course!
Thanks,
Sam Lester (MSFT)
Exploring Big Data: Course 3 – Introduction to NoSQL Data Solutions
(This is course #3 of my review of the Microsoft Professional Program in Big Data)
Course #3 of 10 – Introduction to NoSQL Data Solutions
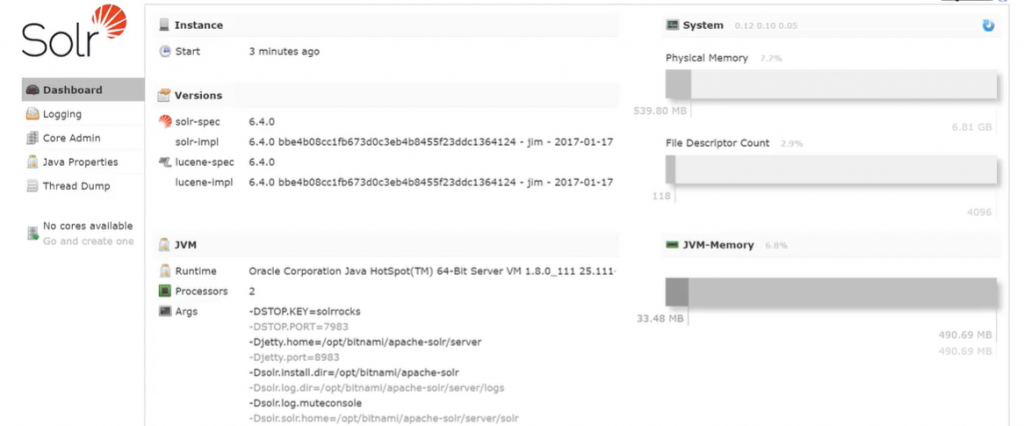
Overview: The "Introduction to NoSQL Data Solutions" course is comprised of five modules, covering NoSQL services in Azure, Azure Storage Tables, DocumentDB in Cosmos DB, MongoDB, and an overview module which briefly introduces Cassandra, Lucene and Solr, HBase, and Redis. The lab instructions are very good, making it easy to get through the labs and explore the resulting solutions. Modules #2-4 are in-depth with a single technology, while module #5 gives a very short introduction into several different technologies.
Time Spent / Level of Effort: I spent roughly 12-14 hours total for this course, including watching all the videos at double speed and completing each of the labs. This course was extremely easy to pass with a high score since both the quizzes and the exam questions were straight from the content. I had passed the required 70% mark before the 5th module but completed it to learn more about these technologies that were new to me.
Course Highlight: Since I have a bit of experience exploring Azure Storage Tables and Cosmos DB, the highlight of this course for me was in module 4 where we installed and executed queries against a MongoDB instance using the Mongo shell. Module #5 was also great to work through as it provided a high-level overview of several technologies. This high level of detail was sufficient for me to learn the basic concepts of the technologies to be able to understand how the tools are used, but not spend much time on each one since it is unlikely that I'll be using any of these technologies soon in my current role. 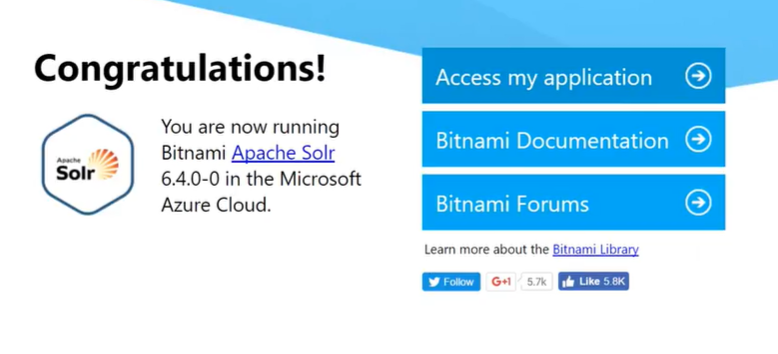
Suggestions: While navigating through the course, be sure to read through the code examples provided in between the videos. The quizzes and final exam use this content extensively. Also, since the labs walk through step-by-step to provide the answers for the quizzes, it is easy to set up the environment and then instantly delete it from your Azure account after answering the questions. Instead of taking this approach, explore the environment (MongoDB, DocumentDB, etc.) to learn more about them.
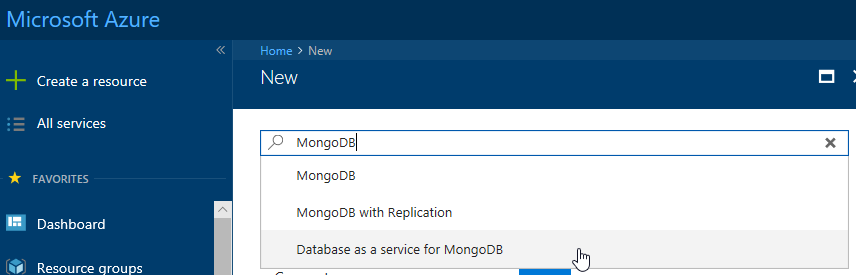
Also, when creating your MongoDB instance, use the "Database as a service for MongoDB" option to create the instance through Cosmos DB as opposed to a Linux hosted instance when selecting the "MongoDB" option.
If you have taken this course in the past or are going through it now, please leave a comment and share your experience.
Thanks,
Sam Lester (MSFT)
Exploring Big Data: Course 4 – Querying Data with Transact-SQL
(This is course #4 of my review of the Microsoft Professional Program in Big Data)
Foreword: For the "Querying Data with Transact-SQL" course, I have asked my outstanding colleague Steve Taylor to share his experience recently completing the course. As a data professional for my entire career, I started working with TSQL in 1999 and have continued to use it regularly since that time. When I took this course as part of the Big Data MPP early in 2016, I jumped straight to the quizzes and final exam to complete the course in a few minutes. As a result, Steve and I thought that his perspective coming from a platforms background and being rather new to TSQL would be a nice addition to the series.
Introduction: My name is Steve Taylor and I'm a Platforms PFE with Microsoft, who is pursuing data science as my IT side-hustle. Sam has asked me to review the two courses that overlap between the MPP for Big Data and the MPP for Data Science, as I've taken both courses more recently than Sam's pilot experience in the Data Science program. Given that I'm just breaking into the data side of things, I'll bring a beginner's perspective to these two courses.
Overview: The course consists of eleven modules, each of which contain assessments and labs, and a final exam. The syllabus starts with an introduction to Transact-SQL, querying with SELECT statements, using Joins and Sets to work with multiple tables in a single query, creating functions, aggregating data in subqueries, table expressions, and grouping sets, modifying data, and finally programming and error handling with transactions in TSQL.
Time Spent / Level of Effort: I could spell S-Q-L before this course, but the only experience I had with querying in this type of syntax was the Windows Query Language (WQL) used in WMI – so this course took me about 11-12 hours to complete. There are just over 7 hours' worth of videos in the course (when watched at 1.0x speed) and the remaining time was spent on the replaying some sections of the videos and completing the knowledge checks, labs, and final exam. If you already have familiarity with Transact-SQL, this course will go much faster for you.
Course Highlight: As someone who had an idea I needed to learn more about SQL to round out my IT skills but had no exposure beyond a half semester course on databases in college, I found this course to be a revelation. The videos are pretty good at explaining the concepts in the syllabus and the real-world use cases for them while working with a real data set.
Suggestions: For these edX courses, I look ahead to the data sets provided and try to follow along with the presenters in the videos (easier done when played at 1.0x speed). There is a GitHub repository with all of the demos used in the videos for this course, which was crucial for me to follow along during the videos and perform the work myself. If you are the kind of student who learns by doing, this is a great aid in following along with the presenters.
Also, I would recommend finding your own coding style for Transact-SQL and sticking with it throughout the course, even if it differs from what the presenters are using or what you see others online posting. The importance is making it consistent, repeatable by you, and readable by others.
If you have taken this course in the past or are going through it now, please leave a comment and share your experience.
Thanks to Steve for the great reviews and for adding a unique perspective to the two overlapping courses (Power BI and TSQL) between the Big Data and Data Science MPP.
Thanks,
Sam Lester (MSFT)
Exploring Big Data: Course 5 – Delivering a Data Warehouse in the Cloud
(This is course #5 of my review of the Microsoft Professional Program in Big Data)
Course #5 of 10 – Delivering a Data Warehouse in the Cloud
Overview: The Big Data course titled "Delivering a Data Warehouse in the Cloud" walks you through the key concepts of a SQL Data Warehouse (DW) in Azure, including the steps to provision a DW, followed by lectures on designing tables and loading data, and completes with big data integration with Hadoop using Polybase. During the course, the four lab exercises require you to install numerous software applications used in a data warehouse environment, including SQL Server Management Studio (SSMS), SQL Server Data Tools (SSDT), Visual Studio Community, Visual Studio Code, Azure Feature Pack for SSIS, and Azure Storage Explorer. The download and installation of these tools is part of the lab exercise as opposed to the course providing a pre-built VM with the required software. As a result, you can't complete labs #2-4 without going through this setup. I would have preferred an image with the required software since I'm very familiar with installing and configuring each of these applications. For those who don't have experience with some of these tools, the course is a great way to walk through installation and basic functionality of data warehouse tools in addition to the Azure DW content.
Time Spent / Level of Effort: I spent about 10 hours total for this course. I watched the videos from part 1 on double speed and then finished the quiz from that section. At that point, I decided to do all four of the labs consecutively. This took me around 2.5-3 hours, but I felt like it was a great use of time to do them back-to-back since I could focus on everything in Azure, including the numerous tools introduced. After completing the labs, I went back to the videos to watch parts 2-4, followed by the quizzes, and then the final exam.
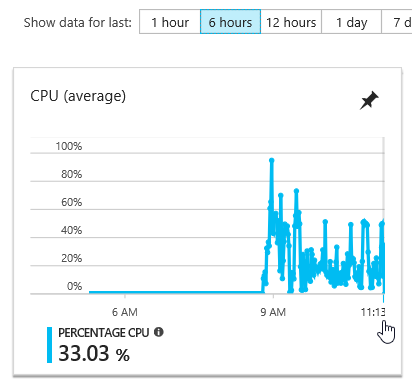
By completing the labs all at one time, I was able to minimize Azure costs by shutting down the VM when finished. Here is the resource usage for the SQL Data Warehouse VM while working through the labs.
Course Highlight: It felt like completing the labs took an exceptionally long time due to the required installation step, but the highlight after finishing the course is that I have a great Azure DW demo environment to continue to use for demos and presentations. I also enjoyed the videos on Polybase since I haven't had a chance to explore this for a customer related project to date. To me, this chance to watch videos and build solutions around popular topics (such as Polybase) while going through the program is a huge benefit to help me remain relevant with so many interesting areas of the data industry. The other aspect of the labs that I enjoyed was the process of executing the same step through two different tools. For example, uploading data through bcp and Azure Storage Explorer as well as running TSQL through both Visual Studio and SSMS.
Suggestions: The final exam for this course was harder than any of the previous 15 edx courses I have taken as it didn't feel like the videos and labs prepared you directly for the questions. I found most of the answers when reading documentation and trying out the scenarios in the lab environment. Don't forget to fill out the final survey / question after completing the course as this contributes to your score. Also notice that I took course #5 directly after completing course #1 since there is no requirement for the ordering of the classes as long as you can stay within the required schedule.
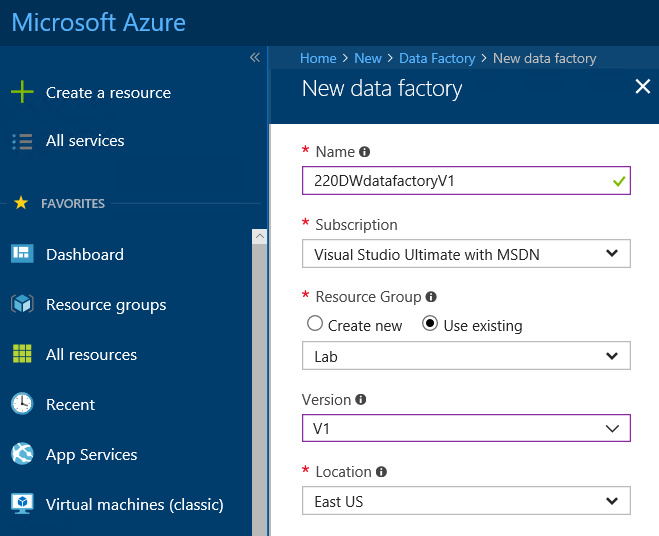
There are also a few small items that I encountered in the labs where the documentation is incorrect in areas where the product functionality has been updated. One example is in populating a table using Azure Data Factory in Lab 3. The default Data Factory version is now V2, but the lab instructions to use the Copy Data functionality are available in version 1 (V1). Creating the Data Factory using Version 1 allows you to continue with the lab as documented.
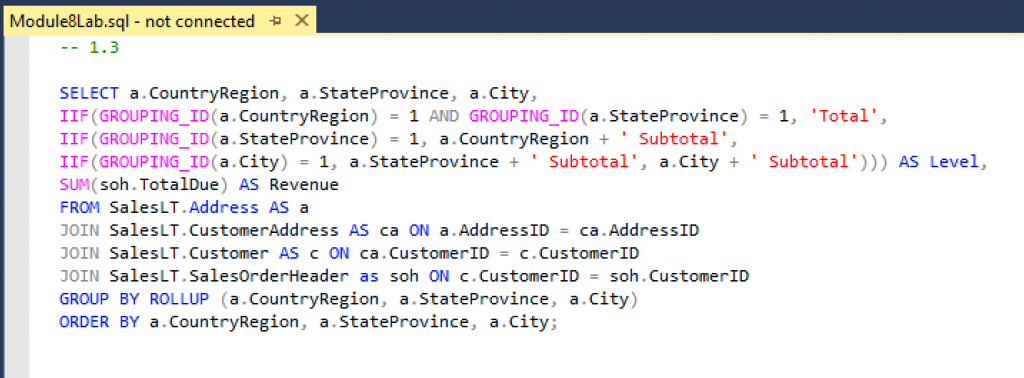
There is another small issue when using TSQL with Polybase to load data. The provided TSQL code begins with the line "CREATE MASTER KEY;". Since this already exists, the script fails. You can work around this by removing this single line and continue with the lab.
Overall, it was a very educational course that covered a lot of material and introduced several software applications used in a data warehouse environment. If you have taken this course in the past or are going through it now, please leave a comment and share your experience.
Thanks,
Sam Lester (MSFT)
Exploring Big Data: Course 6 – Processing Big Data with Azure Data Lake Analytics
(This is course #6 of my review of the Microsoft Professional Program in Big Data)
Course #6 of 10 – Processing Big Data with Azure Data Lake Analytics
Overview: The "Processing Big Data with Azure Data Lake Analytics" course is comprised of four sections of videos and labs, where the lab documentation walks you through the creation of an Azure Data Lake Store, populating the store with data, creating database objects to store the data, and finally in querying the data to answer lab questions. The final challenge is similar in structure but does not provide the detailed code syntax, leaving that exercise to you to figure out.
Time Spent / Level of Effort: This was one of the shorter courses I've taken through Edx, with the entire course taking only 3-4 hours. The four video and lab sections are very easy to follow, with step-by-step instructions to create the required U-SQL jobs to load data into the Azure Data Lake Store, create databases, schemas, and queries.
Course Highlight: I have intended to spend time learning more about U-SQL and this was a perfect course in that regard. I've been writing TSQL code and .NET code for many years, so U-SQL seems like a great subject for me to explore. It is interesting to see U-SQL use the C# data types and the ability to call C# methods on T-SQL objects, such as "SELECT Customer.ToUpper() FROM DB1". I really like the idea of leveraging the power of both technologies over mountains of data within Azure Data Lakes and hope that I'll get the chance to do more work with U-SQL soon.
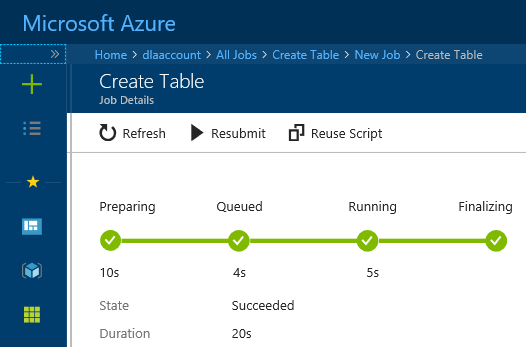
Suggestions: The final lab challenge for this course was different than previous exams in the MPP in that it gave high-level instructions and left the details up to you to figure out. Fortunately, the steps in the final challenge are like those found in the first four lab exercises, so you've already created similar jobs that you can reference. To reuse the script from a previously created job (example: Create Table job from Lab 2), open the job and click on "Reuse Script". This will open the script syntax in a new window and you can edit the query to reflect the task of the final challenge. By reusing the jobs created in the labs, the final challenge was much easier.
Also, in the final challenge, I noticed the "Hint" button in the bottom right corner of the quiz questions. The hints do not affect your score, so use these if you need some extra suggestions to answer the questions.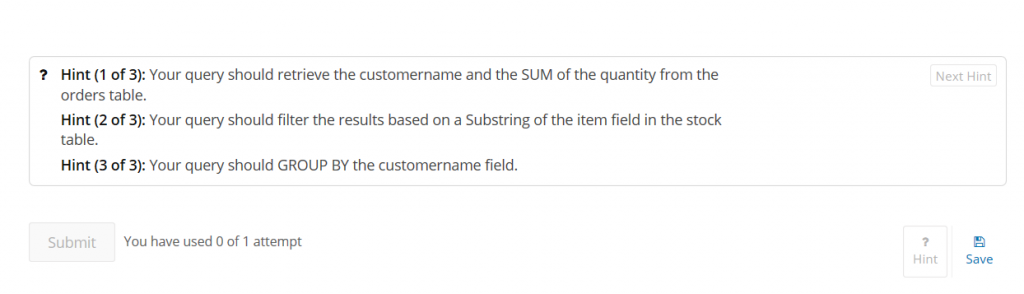
If you have taken this course in the past or are going through it now, please leave a comment and share your experience.
Thanks,
Sam Lester (MSFT)
Exploring Big Data: Course 7 – Implementing Real-Time Analytics with Azure HDInsight
(This is course #7 of my review of the Microsoft Professional Program in Big Data)
Course #7 of 10 – Implementing Real-Time Analytics with Azure HDInsight
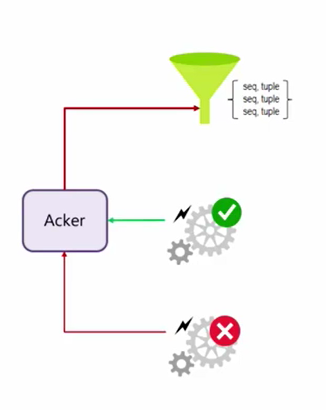
Overview: The "Implementing Real-Time Analytics with Azure HDInsight" course is comprised of three graded sections of videos and labs, teaching the high-level concepts of HBase, Storm, and Spark. There is an additional section of videos on Kafka, but the content is not included in the quizzes and final exam.
Time Spent / Level of Effort: As I do with each Edx course, I opened the homework quiz and the final exam in new windows to be able to watch for the content as it appeared in the videos. After going through the videos for the first main section on HBase, I was able to successfully answer the homework and exam questions for the HBase section. I decided to continue with all the videos and completed the course (graded sections) entirely by only watching the videos in roughly 3 hours. After finishing the graded sections, I then went back and spent about 2.5 hours working through the labs. I finished the videos and exams in a single night and the labs the following night.
Course Highlight: This was the first time I've spent time exploring the concept of processing streaming data. I feel like I have a lot better understanding of handling unending streams of data, such as with IoT sensors or social media activity, by defining streaming temporal windows and determining aspects such as retry logic. 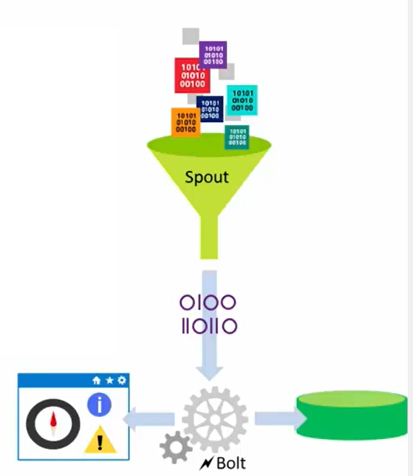
Suggestions: The videos alone were sufficient to easily pass the course with the needed 70%. I watched them all at double speed with the quizzes and exam open in other tabs to watch for the test content. I then went back to complete the labs but having the graded part of the course out of the way was nice to be able to explore the labs on my own as opposed to sticking with the documentation steps.
If you have taken this course in the past or are going through it now, please leave a comment and share your experience.
Thanks,
Sam Lester (MSFT)
Exploring Big Data: Course 8 – Orchestrating Big Data with Azure Data Factory
(This is course #8 of my review of the Microsoft Professional Program in Big Data)
Course #8 of 10 – Orchestrating Big Data with Azure Data Factory
Overview: The "Orchestrating Big Data with Azure Data Factory" course is comprised of four graded sections of videos and labs, covering Azure Data Factory, creating and monitoring pipelines, and performing transformations in U-SQL and Hive. Each section has a step-by-step lab exercise that walks you through the creation of the content covered in the videos followed by a quiz for each section. In addition, there is a final challenge where you perform similar steps as in the labs and answer the final exam questions based on the output.
Time Spent / Level of Effort: As I do with each Edx course, I opened the homework quiz and the final exam in new windows to be able to watch for the content as it appeared in the videos. After going through the videos for the first main section on Azure Data Factory, I was able to successfully answer the review questions. I continued with all the videos and completed the course (graded sections) entirely by only watching the videos in roughly 2 hours. After finishing the graded sections, I then moved to the final challenge. Since I had not completed the step-by-step labs, the final challenge took longer than it likely would have had I done the labs, but I was still able to complete it without much hassle. Overall, the course took roughly 3.5-4 hours and I completed it in one night with a final grade of 100%.
Course Highlight: The course was rather short but packed with great content around Azure Data Factory and pipelines. After now completing eight courses of the Big Data MPP, the highlight for me was in starting to recognize the big picture of how each of these technologies fits together. This course leveraged the work we've done in several previous courses to create Azure components such as storage accounts and Data Lake Analytics, as well as SQL Database and TSQL querying, and U-SQL transformations. I'm looking forward to the capstone course where we'll get a chance to put this all together on a challenging project.
Suggestions: The videos alone were sufficient to easily pass the course with the needed 70%. I watched them all at double speed with the quizzes and exam open in other tabs to watch for the test content. For the final project, I completed the project in Azure and verified my answers locally by using Power BI to open the lab files and perform the calculations. For example, one of the final challenge questions asks for the total amount of an individual order. In Azure, we completed this by using a U-SQL transformation and a pipeline to process the data. To get the answer, we then query the SQL Database for the total. To confirm my answer, I opened the text file in Power BI desktop and created a calculation for this order number. I used this verification trick for two of the three final challenge questions.
If you have taken this course in the past or are going through it now, please leave a comment and share your experience.
Thanks,
Sam Lester (MSFT)
Exploring Big Data: Course 9 – Developing Big Data Solutions with Azure Machine Learning
(This is course #9 of my review of the Microsoft Professional Program in Big Data)
Overview: The "Developing Big Data Solutions with Azure Machine Learning" course is comprised of four sections of videos and labs, each with a set of 3 quiz questions, followed by a 15-question final exam. The labs in each section build upon the work done in the previous labs. The first section introduces Azure Machine Learning Studio, followed by the next three sections where you begin to use Azure ML Studio to create your first predictive experiments.
Time Spent / Level of Effort: This course took me considerably more time than the previous couple courses due to the length of the labs and my high level of interest in this subject matter. If your goal were to complete this course as quickly as possible, you could easily skip all the labs and answer the quizzes/final exam questions by only watching the videos since there are no direct questions based on the lab activity or output. As I do with each edX course, I opened the homework quiz and the final exam in new windows to be able to watch for the content as it appeared in the videos. This allowed me to complete the course with 96% before beginning any of the labs. In total, I spent around 10-12 hours on this course.
Course Highlight: When I completed the Data Science MPP in 2016, my favorite part of the program was the capstone project, where I spent a huge amount of time working in Azure ML Studio. Learning the intricacies of various predictive models, modifying test data, and tweaking model configurations made the final project extremely rewarding and kept me motivated to improve my model long after I obtained the required passing score. This course reminded me how much I enjoy building predictive models in Azure ML Studio.
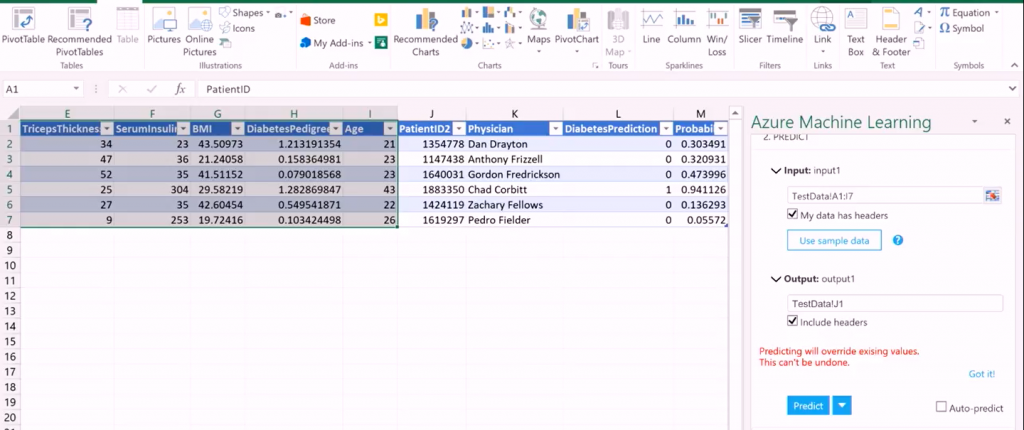
One additional highlight was when we published a predictive model as a web service, then called this web service directly within Excel on our existing data. Seeing this in action and understanding how easy it is to do is really a powerful exercise. This is a great example of the power of combining Excel with Azure ML and predictive analytics.
Suggestions: The videos alone were sufficient to easily pass the course with the needed 70%. I watched them all at double speed with the quizzes and final exam open in other tabs to watch for the test content. Since the Data Science MPP capstone was spent almost entirely in Azure ML Studio, I'm hoping that the Big Data MPP will also do the same. If so, spending a lot of time carefully completing the labs and getting familiar with Azure ML Studio will be great preparation for the final capstone project.
If you have taken this course in the past or are going through it now, please leave a comment and share your experience.
Thanks,
Sam Lester (MSFT)
Compiling a XAML-based project fails in Visual Studio with FIPS enabled
Compiling a XAML-based project fails in Visual Studio in a FIPS-enabled environment with an error message stating "This implementation is not part of the Windows Platform FIPS validated cryptographic algorithms".
Solution:
This bug has been fixed in .NET 4.7.1. As of August 2017, this fix has been released as part of .NET 4.7.1 early access builds and Windows 10 Insider Preview builds from the RS3 (Redstone 3) branch.
Details:
After publishing a recent blog entry about Visual Studio issues in a FIPS-enabled environment, I was contacted by another user who was encountering a somewhat similar problem. Their XAML based projects (created in VS 2010) were throwing the FIPS error when trying to compile in VS 2013 and VS 2015. While the error message was the same, the root cause was different and hence the workaround prescribed in the other article did not solve the problem. After working with the customer to obtain a stack trace, the development team investigated the trace and discovered that the underlying issue was recently resolved and fixed in the .NET 4.7.1 update.
If you encounter any other issues in FIPS-enabled environments, please comment below and I'll help to investigate.
Thanks,
Sam Lester (MSFT)
Help! I can't close the Power BI Desktop Splash Screen!
Today's blog entry is a quick tip to get around what appears to be a Power BI Desktop splash screen that won't go away. This is the first time I've experienced the issue and since the window is modal and I couldn't find a keyboard sequence to close it, I was stuck until I realized the solution. (Note: I discovered it in Power BI Desktop optimized for Power BI Report Server).
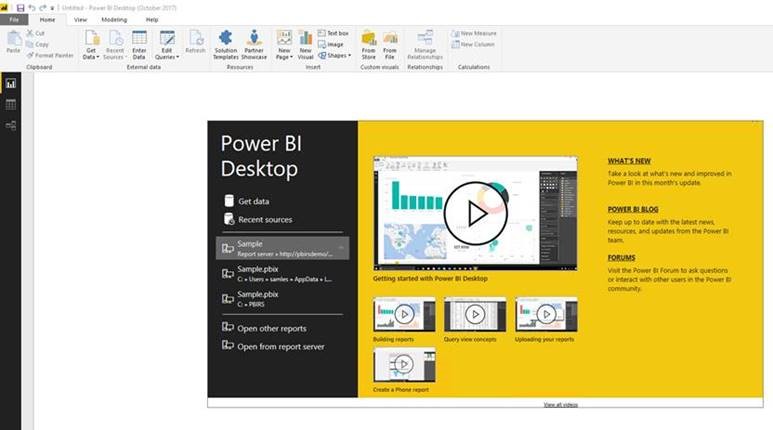
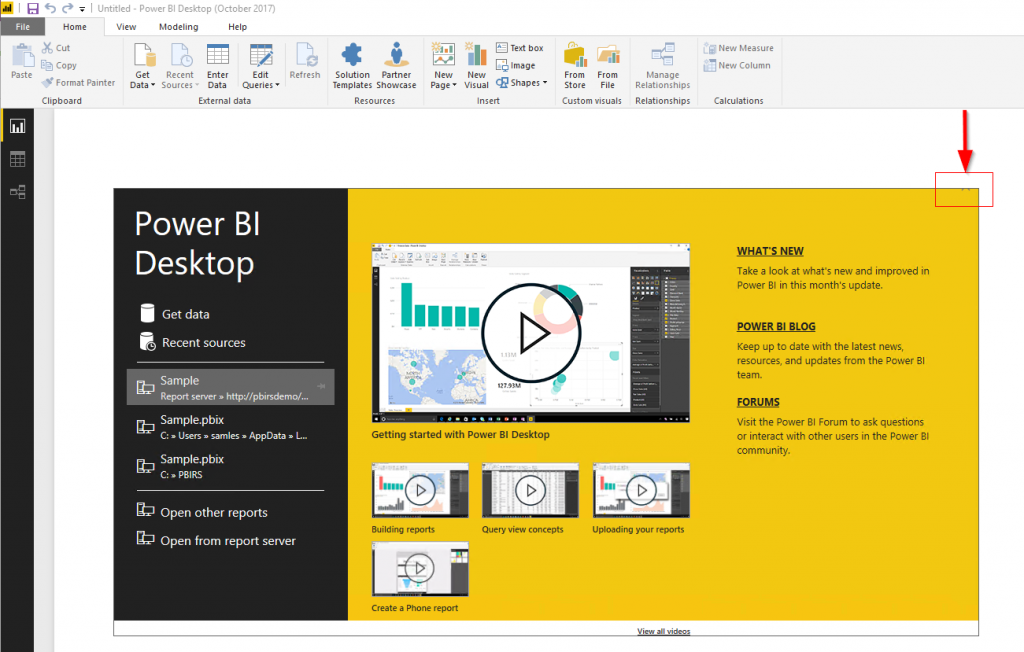
Here's the view that I encountered:
In the image, the splash screen seems to be shifted up, which makes the X (close button) almost invisible. When this window is open, clicking anywhere else in the application has no effect since the window is modal. I tried to close the window with various key sequences (Ctrl+X, Ctrl-C, Esc, etc.), but nothing worked. Fortunately, there a few pixels of the close button that are still in view, but it took some time to find it.
Since I was documenting scenarios for my customers, I had a screenshot of the initial splash screen, which was as expected.
The problem seemed to occur when I opened the application with the auto-recovery toolbar, which was when I noticed the issue for the first time.
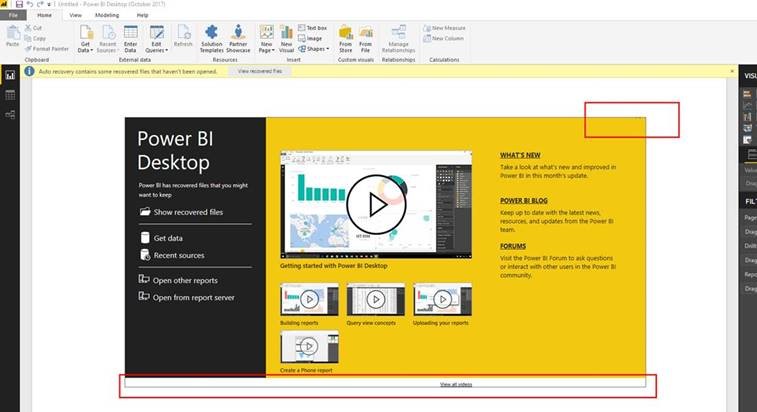
However, I was surprised to see it remain after I'd removed the auto-recovery files and reopened the application. I've sent the details on to the wonderful Power BI Desktop product team and will update this article once I hear back from their investigation.
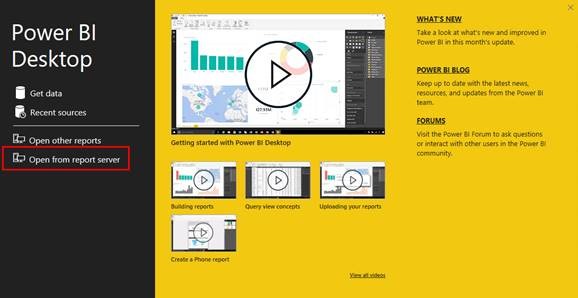
If you have encountered this issue, search for the small area in the top right of the screen where you can close the window, and please leave a quick comment below.
Thanks,
Sam Lester (MSFT)
Popular posts from this blog
[Excel] 문서에 오류가 있는지 확인하는 방법 Excel 문서를 편집하는 도중에 "셀 서식이 너무 많습니다." 메시지가 나오면서 서식을 더 이상 추가할 수 없거나, 문서의 크기가 예상보다 너무 클 때 , 특정 이름이 이미 있다는 메시지가 나오면서 '이름 충돌' 메시지가 계속 나올 때 가 있을 것입니다. 문서에 오류가 있는지 확인하는 방법에 대해서 설명합니다. ※ 문서를 수정하기 전에 수정 과정에서 데이터가 손실될 가능성이 있으므로 백업 본을 하나 만들어 놓습니다. 현상 및 원인 "셀 서식이 너무 많습니다." Excel의 Workbook은 97-2003 버전의 경우 약 4,000개 2007 버전의 경우 약 64,000개 의 서로 다른 셀 서식 조합을 가질 수 있습니다. 셀 서식 조합이라는 것은 글꼴 서식(예- 글꼴 종류, 크기, 기울임, 굵은 글꼴, 밑줄 등)이나 괘선(괘선의 위치, 색상 등), 무늬나 음영, 표시 형식, 맞춤, 셀 보호 등 을 포함합니다. Excel 2007에서는 1,024개의 전역 글꼴 종류를 사용할 수 있고 통합 문서당 512개까지 사용할 수 있습니다. 따라서 셀 서식 조합의 개수 제한을 초과한 경우에는 "셀 서식이 너무 많습니다." 메시지가 발생하는 것입니다. 그러나 대부분의 경우, 사용자가 직접 넣은 서식으로 개수 제한을 초과하는 경우는 드뭅니다. 셀 서식이 개수 제한을 넘도록 자동으로 서식을 추가해 주는 Laroux나 Pldt 같은 매크로 바이러스 에 감염이 되었거나, 매크로 바이러스에 감염이 되었던 문서의 시트를 [시트 이동/복사]하여 가져온 경우 시트의 서식, 스타일이 옮겨와 문제가 될 수 있습니다. "셀 서식이 너무 많습니다." 메시지가 발생하지 않도록 하기 위한 예방법 글꼴(종류, 크기, 색, 굵기, 기울임, 밑줄), 셀 채우기 색, 행 높이, 열 너비, 테두리(선 종류, ...
How to control your World with Intune MDM, MAM (APP) and Graph API
VSS yedekleme testi nasıl yapılır Exchange üzerinde bulunan verilerin yedeklenmesi (backup) ve geri yüklenmesi (restore) baslibasina çok önemli bir konudur. Bir yedegin saglikli alinmasi kadar restore isleminin basarili bir biçimde yapilabilmesi de test edilmesi gereken önemli bir islem. Exchange destegi olan (aware) diye adlandirdigimiz yazilimlar exchange writer'lari kullanarak VSS teknolojisi ile yedek alirlar. Yedekleme esnasinda karsilasilan sorunlarin büyük bölümünün nedeni, yazilimlarin uyumsuzlugu ya da bu yazilimlardaki yanlis bir ayar olabilmektedir. Bunun tespiti için, yani yedek alma sirasinda sorunun VSS Writer'dan mi, disk sisteminden mi ve/veya yedekleme yazilimindan mi kaynaklandigini anlayabilmek için Betest aracini kullanabilirsiniz. BETEST, Windows SDK yada Volume Shadow Copy Service SDK 7.2 (sonraki versiyonlarda mevcut) içerisinde bulunan yardimci bir araçtir. Araci kolaylikla bulabilir ve kurabilirsiniz. Kurulum islemini exchange sunucunuz...
ASP.NET AJAX RC 1 is here! Download now
Moving on with WebParticles 1 Deploying to the _app_bin folder This post adds to Tony Rabun's post "WebParticles: Developing and Using Web User Controls WebParts in Microsoft Office SharePoint Server 2007" . In the original post, the web part DLLs are deployed in the GAC. During the development period, this could become a bit of a pain as you will be doing numerous compile, deploy then test cycles. Putting the DLLs in the _app_bin folder of the SharePoint web application makes things a bit easier. Make sure the web part class that load the user control has the GUID attribute and the constructor sets the export mode to all. Figure 1 - The web part class 2. Add the AllowPartiallyTrustedCallers Attribute to the AssemblyInfo.cs file of the web part project and all other DLL projects it is referencing. Figure 2 - Marking the assembly with AllowPartiallyTrustedCallers attribute 3. Copy all the DLLs from the bin folder of the web part...


Comments
Post a Comment