Skip to main content
OAuth using PowerShell and certificate Service Principal to Azure Function App
The NDIS Blog: We're back!
Now with witty subtitles
Lately things have been quiet on the NDIS blog. But that's about to change, because we've got some new blog posts lined up for you. We'll start things off this week with a discussion on OID requests.
If you would like to suggest a topic, please leave a note in the comments.
TMF download page
Are you targeting Windows 8 or Windows Server 2012? You don't need anything from here! These operating systems already include all the TMFs you'll need in the PDB from the Microsoft Symbol Server.
For Windows 7 and Windows Server 2008 R2, here is a copy of the TMF decoders for NDIS.SYS:
→ Download here.
This file was last updated on July 24 2015, and includes traces for the following versions of NDIS:
- RTM
- KB977927
- KB981765
- KB2471472
- KB2482122
- SP1
- KB2624668
- KB2697537
- KB2688892
- KB2719857
- KB2729608
- KB2894906
- KB2974617
- KB3014793
NDIS traces messages at the following verbosity levels
| Level | Name | Description |
| 1 | Severe errors | NDIS doesn't use this level much. It's mostly interchangeable with the Errors level. |
| 2 | Errors | An error that will definitely cause something to break. Example: miniport installation will fail because a registry key is missing. |
| 3 | Warnings | An unusual condition that might need fixing. Example: miniport indicated a malformed status indication, and NDIS dropped it. |
| 4 | Info | Informational messages. Example: miniport is going into low power mode now. |
| 5 | Verbose | NDIS doesn't use this level much. It's reserved for a few messages that aren't usually useful |
NDIS recognizes the following flags:
| Flag value | Name | Description |
| 0x00000001 | Initialization | |
| 0x00000002 | Configuration | |
| 0x00000004 | Send | The Send and Receive traces can be very noisy. Only enable them if you have a specific problem with the datapath. If possible, limit the number of packets sent while tracing these. |
| 0x00000008 | Receive | The Send and Receive traces can be very noisy. Only enable them if you have a specific problem with the datapath. If possible, limit the number of packets sent while tracing these. |
| 0x00000010 | Protocol | |
| 0x00000020 | Bind | |
| 0x00000040 | Bus | Traces miniport's access to underlying hardware, if the miniport uses NDIS APIs to do so. (WDM miniports will not go through NDIS to access their hardware). |
| 0x00000080 | Registry | Traces how external drivers use the Ndis Configuration APIs |
| 0x00000100 | PnP Event Memory Allocation | (PnP Event on Windows 7 / Windows Server 2008 R2 and later; Memory Allocation on Windows Vista / Windows Server 2008) |
| 0x00000200 | Light-Weight Filter | |
| 0x00000400 | OID Request | |
| 0x00000800 | Work Item | Traces the occasional maintenance that NDIS needs to do on work items, including miniport reset |
| 0x00001000 | PNP | |
| 0x00002000 | Power Management | |
| 0x00004000 | Protocol Reference Counting | (Windows Vista / Windows Server 2008 only) |
| 0x00004000 | Selective Suspend | (Windows 8 / Windows Server 2012 and later) |
| 0x00008000 | Lock | (Windows Vista / Windows Server 2008 only) |
| 0x00010000 | Reset | |
| 0x00020000 | WMI | |
| 0x00040000 | CoNDIS | |
| 0x00080000 | Reference Counting | |
| 0x00100000 | Memory Allocation | |
| 0x00200000 | NDISIF | |
| 0x00400000 | NDIS Port | |
| 0x00800000 | Status Indication | |
| 0x01000000 | Receive Queues (VMQ) | (Windows 7 / Windows Server 2008 R2 and later) |
| 0x02000000 | SR-IOV | (Windows 8 / Windows Server 2012 and later) |
| 0x04000000 | Miscellaneous | Features that are not generally of interest to third party developers, like CEIP bookkeeping. (Windows 8 / Windows Server 2012 and later) |
| 0x08000000 | Bind Engine | State changes for protocol and filter bind, unbind, pause, and restart (Windows 8.1 / Windows Server 2012 R2 and later) |
ndistmf.zip
Troubleshoot a Windows bluescreen, a.k.a bugcheck, a.k.a blue screen of death
I have read a lot of posts in multiple forums on the internet where people ask "My machine keeps bluescreen-ining, what do I do?"... a common response is "Reinstall Windows and the problem will most likely go away". This is a wrong answer because if you simply reinstall Windows you don't know what caused the blue screen and if you don't know what caused it you cannot prevent it from happening again. So the correct answer is: find out what driver is causing the blue screen and then either a) stop using the driver or b) call your PC/device manufacturer and ask them for a fixed driver.
This post summarizes what a technically savvy user can do to troubleshoot and mitigate a bluescreen on his Windows PC.
Here are the quick steps:
1. Install the Windows Debugger
2. Load C:\Windows\MEMORY.DMP in the debugger
3. Load the debugging symbols for the crashing OS
4. Issue the '!analyze -v' command and read the output. It will tell you what driver caused the crash among many other useful things it will reveal.
Here is the long version:
What is a bug check?
When Windows encounters a condition that compromises safe system operation, the system halts. The system halt is a direct result from a kernel mode component (driver) calling either the KeBugCheck(...) or KeBugCheckEx(...). This condition is called a bug check. It is also commonly referred to as a system crash, a kernel error, a Stop error, a Blue Screen, or a Blue Screen Of Death (BSOD) .
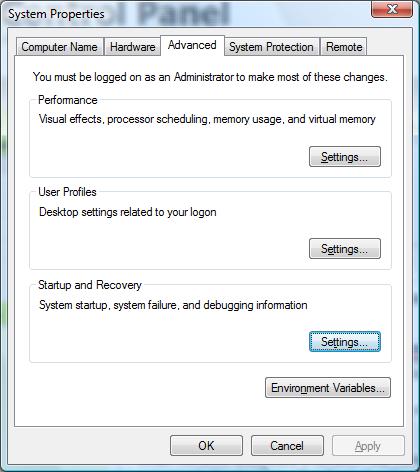
Windows has default settings which control whether the system will automatically restart after a bug check, whether the system will write a mini dump, kernel dump or a full memory dump and wheter it should overwrite the previous dump file. The dumps differ in size and thus they differ in the ammount of information saved at the time of the crash. You can view and change these settings by going to Control Panel -> System Properties -> Advanced tab -> 'Startup and Recovery' Settings. Here is the UI for the System Properties on Windows Vista:


As you can see in the screen shot on the right, on Windows Vista the default is for the system to automatically reboot after a bug check and save a kernel memory dump. On Windows XP the default is for the system to automatically reboot after a bug check and save a mini dump.
The key takeaway is that : a) if your machine restarts when you didn't expect it to, the system bug checked; b) in order to figure out what driver caused the bug check it is best that you have a kernel dump (this is the default on Vista).
How do you diagnose what driver caused the bug check?
The steps are as follows:
- Save the C:\Windows\memory.dmp file somewhere handy (note that the drive letter might be different, depending on which partition you installed Windows on)
- Note that depending on your system settings you might have a 'mini-dump'. To find all the dump files on the system do 'C:\>dir /s *.dmp'
- Download the Windows Debugger. I highly recommend that you spend some time reading through the help file. Specifically, read the 'Debugging Techniques -> Elementary Debugging Techniques' section
- Start WinDBG (debugger with UI front end) or alternatively you can use the command prompt debugger called 'kd'. 'kd' is located in the directory where you installed the debugger. Here is what you should see...

- Load the memory dump from #1 in the debugger by doing: File -> Open Crash Dump and pointing to the MEMORY.DMP file.
- Load the symbols for the crashing OS by doing: File -> Symbols File Path and point to the directory where you extracted the symbols package. Here is what you should see...
- You can download the symbols package for your OS version from here. Note: Pay attention to the CPU architecture when downloading symbols. The symbols are different for x86, x64 and IA64.
- in the lower right corner is the command line, issue the command !analyze -v and you should see plenty of information about the crash. Here is an example:
0: kd> !analyze -v
*******************************************************************************
* *
* Bugcheck Analysis *
* *
*******************************************************************************
DRIVER_POWER_STATE_FAILURE (9f)
A driver is causing an inconsistent power state.
Arguments:
Arg1: 00000003, A device object has been blocking an Irp for too long a time
Arg2: 8445c700, Physical Device Object of the stack
Arg3: 84fe9428, Functional Device Object of the stack
Arg4: 870ddae0, The blocked IRP
Debugging Details:
------------------
DRVPOWERSTATE_SUBCODE: 3
DEVICE_OBJECT: 84fe9428
DRIVER_OBJECT: 85269e68
IMAGE_NAME: NETw3v32.sys
MODULE_NAME: NETw3v32
FAULTING_MODULE: 8c210000 NETw3v32
DEFAULT_BUCKET_ID: VISTA_BETA2
BUGCHECK_STR: 0x9F
PROCESS_NAME: System
CURRENT_IRQL: 2
LAST_CONTROL_TRANSFER: from 82c1ef3e to 82cd53a9
STACK_TEXT:
80803e1c 82c1ef3e 0000009f 00000003 8445c700 nt!KeBugCheckEx+0x1e
80803e78 82c24841 80803f5c 00000000 82cf8e20 nt!PopCheckIrpWatchdog+0x165
80803eb0 82c7365e 82d0c1c0 00000000 85523e08 nt!PopCheckForIdleness+0x2d5
80803f88 82c724e0 00000000 00000000 00401229 nt!KiTimerExpiration+0x60c
80803ff4 82c61aa9 82a63a48 00905a4d 00000003 nt!KiRetireDpcList+0xca
80803ff8 82a63a48 00905a4d 00000003 00000004 nt!KiDispatchInterrupt+0x3d
WARNING: Frame IP not in any known module. Following frames may be wrong.
80803ffc 00905a4d 00000003 00000004 0000ffff 0x82a63a48
80804000 00000000 00000004 0000ffff 000000b8 0x905a4d
---------
In the example above the driver at fault was NETw2v32.sys. Note that the !analyze command does not always give the correct driver that crashed the system. For example if driver A corrupts driver B's data structure and driver B access that data structure and crashes the !analyze command might blame driver B where in reality driver A was at fault. So whenever memory corruption is involved !analyze cannot be trusted completely.
- Rade Trimceski
sys_prop.jpg
Using C++ in an NDIS driver
Are NDIS drivers allowed to use C++?
The first question is easy: can NDIS drivers be written in C++? The answer: yes. In this case, NDIS doesn't have any official stance on C++, so we just fall back on the WDK's general rules. As of Windows Driver Kit 8, Microsoft officially supports using a subset of the C++ language in drivers. ("Subset? What subset?" There's more precise information here.)
The inevitable follow-up question is more nuanced: should NDIS drivers be written in C++? The answer is: it depends. Here are some facts that will help you derive a more specific answer:
- The NDIS API is a C API. There is no NDIS API that magically gets better or worse when you're coming from C++ versus C.
- The NDIS team has no future plans to make a feature that requires C++. We are well-aware that many of our developers are dedicated fans of C, and have strong opinions on C++. Don't worry — C isn't going anywhere.
- The NDIS team may, in the future, add minor conveniences that only light up in C++. For example, the WDK macro ARRAYSIZE is defined differently for a C++ driver, which gives it better abilities to detect misuse with pointers. NDIS.H may start adding macros that offer minor improvements for C++ code, just like WDM.H already has today.
- Several major IHVs build their production NDIS miniport drivers using C++.
- Several major IHVs build their production NDIS miniport drivers using C.
- Microsoft builds some drivers in C and some drivers in C++.
- Our NDIS sample drivers are all in C. (This is largely for historical reasons, as these drivers were created before C++ was officially supported. If we were creating a new sample today, we'd consider writing it in C++.)
In summary, then, either language works fine, and it all comes down to a matter of your preference.
Using the checked version of NDIS.SYS
I assert that this is a good way to find bugs
Installing the checked version of the operating system is an effective technique to quickly find bugs in your network driver. If you're not familiar with checked builds (and even if you are), you should read the excellent documentation here. Seriously, read it; I won't repeat it here.
What do you get with the checked build of NDIS?
The main difference is that NDIS's implementation has (as of Windows 8.1) approximately 2200 extra asserts. While some of these asserts verify NDIS's internal bookkeeping is consistent, many of them verify that your driver uses NDIS's APIs correctly. For example, NDIS asserts the current IRQL is correct when each MiniportXxx callback returns, to help catch the class of bug where your miniport driver leaks an IRQLs or spinlock.
Prior to Windows 7, using the checked build of NDIS is also the only way to see NDIS's debug traces. But as of Windows 7, these traces are now available from WPP, so there's no longer a need to use the checked build solely for tracing.
What's the downside of using a checked build?
There are two downsides to using checked builds: performance and false-positives.
Checked builds are noticeably slower. But they aren't as bad as you might think. We still compile checked builds with most compiler optimizations enabled, so the only slowdowns are a few extra verifications here and there. Still, the operating system has zillions of assertions, so those do add up. You definitely don't want to use a checked build for any performance-related work. But they're just fine for initial work on a new feature or functional testing.
False positives are also a problem. Sometimes you'll see assertions that fail for reasons that don't seem to be related to your driver. When you see an unfamiliar assertion, you'll first want to spent a moment to convince yourself that the assertion failure is really caused by your driver. For example, if there's an assertion in win32k.sys about an invalid HRGN, that's probably not caused by any network driver. Prior to Windows 8, the operating system was kind of "noisy"; a nontrivial percentage of its assertions would fire for benign reasons. We worked hard to clean that up in Windows 8, so the asserts have a better signal-to-noise ratio. (Like many Windows engineers, I used a checked build of the OS as my primary workstation for some time during Windows 8 development. That was fun.)
If you discover an assertion in NDIS.SYS that you believe is a false positive, please let me know here and I'll try to clean that up. (Unfortunately I'm not knowledgeable about non-networking drivers, so I can't promise I can help you with any random assertion that you come across.)
How can you get the checked build of NDIS?
MSDN has the story on how to download a copy of the checked build. From there, you have two options:
Since MSDN already explains the first option, I won't repeat those instructions here. Let's talk about the second option: how to selectively replace a few drivers.
First, identify the drivers that you want to replace. Here's a table of drivers you can consider replacing:
| The kernel & HAL | Always |
| NDIS.SYS | Always |
| TCPIP.SYS | Miniport, LWF, and WFP callout drivers |
| NETIO.SYS (Windows Vista and later) | Whenever TCPIP.SYS is replaced |
| FWPKCLNT.SYS | WFP callout drivers |
| (your bus driver, e.g., PCI.SYS) | Miniport drivers |
| NWIFI.SYS | Native 802.11 drivers |
| VWIFIBUS.SYS VWIFIFLT.SYS VWIFIMP.SYS | Native 802.11 drivers that implement MAC virtualization (WFD or SoftAP) |
| NDISUIO.SYS | WWAN drivers |
| WMBCLASS.SYS | WWAN drivers that implement the class driver model |
| VSWITCH.SYS | Hyper-V extensible switch extension |
Keep in mind — these are just guidelines. You are not required to test with any particular set of drivers, and you might want to fine-tune the list depending on what subsystem you're targeting. If you are unsure about which binaries to replace, remember you can always just install the entire checked OS, which gives you the maximum checked build coverage.
Now that you know which drivers to replace, you can extract them from the checked build media. If you obtained installable media, you can mount the included INSTALL.WIM with DISM.EXE to get at the individual drivers, or you can just install the OS into a throw-away VM to get convenient access to its drivers.
Finally, you'll need to actually replace these drivers on your target OS. Don't do this on a production OS machine; we can't officially support this. The easiest way to replace binaries is to hook up a kernel debugger and use the .kdfiles feature. For example, here's the mapfile that I use to replace NDIS.SYS on a test machine:
map \Windows\system32\DRIVERS\NDIS.SYS c:\path\to\ndis.sys
Note that the name of the driver will depend on how the driver is loaded. Use CTRL+D or CTRL+ALT+D in the debugger and reboot the target machine to see the official name of each driver.
Note that the process for replacing the kernel & HAL is special.
Oh, and sorry for the awful pun in the subtitle.
Using WDF in an NDIS driver
Can, Should, and How?
WDF is a framework that makes it easier to write Windows drivers. NDIS is a framework for writing low-level Windows network drivers. The purposes of these frameworks overlap a bit, and some people (okay, probably many people) are confused about the relationship between NDIS and WDF. Today we'll set down a few guidelines. But first – let's dispel one tenacious myth.
Myth: Some people think that NDIS drivers cannot use WDF.
In reality, you can use WDF in your NDIS driver. I know this works rather well, because I have personally written several WDF-based NDIS drivers.
So where do people get the idea that WDF is incompatible with NDIS? There are a few sources of this idea:
- When writing an NDIS miniport driver, certain parts of WDF are not compatible with NDIS. You must put WDF into a mode sometimes referred to as "miniport mode". Not all WDF APIs are available in miniport mode. See the step-by-step checklist here. Note that this restriction only applies to NDIS miniport (and IM) drivers; protocols and LWFs can use the full breadth of WDF functionality.
- Miniport drivers must also put NDIS into a special mode, called NDIS-WDM mode. This is a poor name, because it seems to indicate that you must use WDM. The reality is that NDIS-WDM mode just means your driver can use any non-NDIS framework. (At the time that NDIS-WDM mode was invented, there were no other frameworks besides WDM, so the name didn't seem to be too constraining. If it helps, you can think of it as NDIS-WD* mode.)
- Most of the NDIS drivers that are included with Windows (like TCPIP) don't use WDF. But this isn't because Windows developers are avoiding WDF; it's because most inbox drivers simply predate WDF. If we were writing the network stack from scratch, we'd use more WDF. New drivers like MSLLDP, an NDIS protocol driver included with Windows 8, are indeed based on WDF.
Now that we know you can combine WDF with NDIS, let's talk about whether you should combine WDF with NDIS. In nearly all cases, an NDIS driver will work with or without WDF. So you rarely have the decision forced upon you by the technology. Ultimately, it will come down to what you decide, based (hopefully) on a good engineering judgment call. Let's collect some evidence to help you make that decision.
Reasons you should use WDF in your NDIS driver
- Your engineering team is already familiar with WDF.
- You will be developing several drivers, including non-networking drivers. (Might as well learn WDF now, and maybe you can share some library code between your drivers.)
- Your driver already uses WDF.
- You are writing an NDIS miniport that uses IRPs on its lower edge (USB, SDIO, etc.)
- You are writing a protocol or LWF that interacts with non-NDIS parts of the OS (usermode IOCTLs, WSK requests, etc.)
- Your code would benefit from WDF's clever object management system to avoid memory leaks.
- You are new to Windows driver development, and have no idea where to start 😰
Generally speaking, it's a good idea to consider WDF. But there are a few reasons why WDF might not be very useful to your NDIS driver:
Reasons that WDF won't help in your NDIS driver
- Your engineering team is already very familiar with NDIS, but has no experience with WDF.
- You are maintaining a mature driver that does not use WDF.
- You are writing a simple NDIS miniport on a directly-connected bus (like PCI).
- You are writing a protocol or LWF that has minimal interaction with the rest of the OS. This driver mostly only calls NDIS APIs.
- Your codebase must be compatible with platforms where WDF is not available (like Windows CE).
Mind you, it's still quite possible to link against WDF in these situations. But you'll probably find that there aren't a lot of opportunities to actually use WDF APIs. Integrating with WDF doesn't give a lot of value if you don't call its APIs. In those cases, the pragmatic engineering decision may be to just not use WDF.
Okay, so let's suppose you've decided to give WDF a spin. You'll eventually notice that WDF overlaps somewhat with NDIS. For example, both frameworks have APIs for workitems (NdisQueueIoWorkItem versus WdfWorkItemEnqueue). Which API should you use? Again, in many cases, either framework's APIs will work. Again, it's an engineering decision that ought to consider several factors, including maintaining consistency with your other code, etc. But if you are new to NDIS and WDF, you can use this quick-reference table as a starting place for your decision-making process.
| Work items | Avoid | Preferred | Do not use |
| Timers | Avoid | Preferred | Do not use |
| Memory allocation | Avoid | Preferred | Okay |
| Locks & interlocks | Avoid (but RW locks are okay) | Preferred | Preferred |
| Events | Avoid | Preferred | Preferred |
| String handling | Avoid | Preferred | Preferred |
| DMA | Preferred | Preferred | Avoid |
| Interrupts | Preferred | Not permitted | Not permitted |
| DPCs (for miniports) | Preferred for interrupts | Okay for non-interrupts | Avoid |
| DPCs (for non-miniports) | Avoid | Preferred | Avoid |
| Processor information | Avoid (except RSS APIs) | (no equivalent) | Preferred |
| IRPs and IOCTLs (for miniports) | Required | Not permitted | Not permitted |
| IRPs and IOCTLs (for non-miniports) | Avoid | Preferred | Avoid |
| Direct bus/port access | Okay | Preferred | Preferred |
| Reading configuration | Preferred for standard keywords | Preferred for other registry values | Okay for other registry values |
| File I/O | Avoid | (no equivalent) | Preferred |
Remember, the above table only contains guidelines. It is still acceptable to ship a driver that uses an API marked "Avoid". You should use the table to help nudge your decision-making when you have no other compelling reasons to use a particular API family.
Welcome to the NDIS and NDISTest blog
Welcome to the NDIS and NDISTest blog... we are just getting started so be patient.
We want this blog to be a place where you can come and learn about the latest NDIS APIs, NDISTest test tool, get answers to your questions and more... stay tuned...
- The Network Devices Platform team, a.k.a the NDIS team
What causes a bug check 0xD1 (IRQL_NOT_LESS_OR_EQUAL)
The MSDN document summarizes the cause for the D1 (IRQL_NOT_LESS_OR_EQUAL) pretty well, for people who know how the memory manager in Windows works. It basically says that the cause is: A driver tried to access an address that is pageable (or that is completely invalid) while the IRQL was too high. This bug check is usually caused by drivers that have used improper addresses.
Detour to the memory manager: in order to understand the D1 bugcheck we have to (briefly) discuss the memory manager subsystem and how it works. The memory manager runs at IRQL 0 (sometimes called PASSIVE) – in other words it runs as a thread with regular priority. If a driver tries to access some piece of memory the processor will throw an "exception" if the memory is not in the RAM (its not paged in). The memory manager will catch this exception, fetch the memory from disk and return the CPU's attention to the driver that tried to access the memory in first place and now the memory will be paged in. The problem occurs when the driver that is trying to access the memory is running at a higher IRQL, for example IRQL 2 (a.k.a DPC – Deffered Procedure Call).
This is a problem because when the driver accesses paged out memory at IRQL 2, the memory manager will be invoked to page-in the memory and it runs at IRQL 0. Code at lower IRQL cannot preempt code at a higher IRQL so the memory manager bugchecks the system since no forward progress can be made (deadlock) at this point and the memory manager knows that this is unrecoverable error. Read this white paper [.doc] for a more in-depth explanation of thread scheduling, thread context and driver routines, driver threads, and Interrupt Request Levels (IRQL) in Windows.
It is important to remember that the driver can be merely trying to access paged-out memory or it can be trying to access some invalid memory address. For example if a driver is trying to access memory address 0x4E41F00F the system will crash with 0xD1 because this is not a valid kernel mode address. The kernel address space usually starts at 0xFF… This reference is most likely a bug or memory corruption that eventually manifests itself as a bad pointer. When we try to reference memory at that bad pointer we get a D1 bug check.
- Rade Trimceski
Why is there a redundant Restart-NetAdapter cmdlet?
Sometimes you can't just Enable your way out of a Disable mess
Windows 8 and Windows Server 2012 include a whole set of new PowerShell cmdlets to manage the network stack. These cmdlets include Enable-NetAdapter and Disable-NetAdapter. Believe it or not, those two cmdlets let you enable and disable your network adapters, respectively. Want to shut off networking in a hurry?
PS C:> Disable-NetAdapter *
If that were all you needed to know, these cmdlets would be so obvious, they wouldn't even be worth writing about. As you might have guessed from the length of this page, there are actually a few surprises lurking in the void between Enable and Disable.
Suppose you want to set a few advanced properties on the NIC named "Ethernet". You might write this script:
Set-NetAdapterAdvancedProperty Ethernet -DisplayName 'Flow Control' -DisplayValue Disabled
Set-NetAdapterAdvancedProperty Ethernet –DisplayName 'Jumbo Packet' -DisplayValue Disabled
That'll work just fine, but it's a little klunky. By default, the Set-NetAdapterAdvancedProperty cmdlet restarts the NIC, so the new value takes effect immediately. But when you set 2 or more properties in a row, the NIC goes through unnecessary restarts. Recognizing this inefficiency, you might try a new version of the script that coalesces all the restarts to the end:
Set-NetAdapterAdvancedProperty Ethernet -NoRestart -DisplayName 'Flow Control' -DisplayValue Disabled
Set-NetAdapterAdvancedProperty Ethernet -NoRestart –DisplayName 'Jumbo Packet' -DisplayValue Disabled
Disable-NetAdapter Ethernet
Enable-NetAdapter Ethernet
But now you find that that script fails while trying to re-enable the adapter. What gives?
It turns out that the Disable-NetAdapter cmdlet is asynchronous. It initiates the disable operation, then returns immediately back to the script, before the adapter is fully disabled. When the script then tries to call Enable-NetAdapter on the NIC, the Enable cmdlet fails, because the adapter isn't fully disabled yet.
While you could work around the race by inserting Start-Sleep, there's a better way: Restart-NetAdapter. The Restart-NetAdapter cmdlet combines a Disable and an Enable into a single operation. Restart-NetAdapter ensures that the Enable operation happens as soon as possible, but no sooner.
So Restart-NetAdapter is better than just a script that calls Disable-NetAdapter + Enable-NetAdapter. Really, the whole is greater than the sum of its parts.
Surprise 2: Wildcard matching doesn't always work
Update in 2017: MSDN blogs was migrated to Wordpress, which apparently ate all the inline SVG that was here. Unfortunately, the pictures that accompanied this page are gone for now. I've left the text.
We saw earlier how a grumpy administrator might try to disable all the NICs on the system with Disable-NetAdapter *. It seems logical that the proper way to re-enable your NICs is to run Enable-NetAdapter *. But there's a subtlety here: the * wildcard doesn't always match the same set of NICs in both commands. Let's see what happens if you use NIC Teaming to create a team, then try to disable and re-enable all the NICs.
Initially, both the physical NIC and the Team Interface are enabled:
(Picture: team interface & NIC are both enabled)
Then we run Disable-NetAdapter *, and Windows evaluates the wildcard to both adapters. Both get disabled:
(Picture: team interface & NIC are both disabled)
But when Microsoft NIC Teaming detects that all member NICs have been disabled, NIC Teaming will remove the entire team:
(Picture: team interface is missing & NIC is disabled)
Now when you run Enable-NetAdapter *, the wildcard matches all adapters: but only one adapter exists! The cmdlet only enables the physical NIC:
(Picture: team interface is missing & NIC is enabled)
Finally, NIC Teaming notices that one of its member NICs has returned, so NIC Teaming restores the Team Interface(s). But remember, the last thing we did to the team interface was disable it, so the team interface comes up in a disabled state:
(Picture: team interface is disabled & NIC is enabled)
So as you can see, Enable-NetAdapter * does not completely undo the effects of Disable-NetAdapter *. What, then, is a good way to do this? Restart-NetAdapter to the rescue, again. When you run Restart-NetAdapter *, the wildcard is only evaluated once, so it includes the Team Interface, before the Team Interface is removed.
Bonus surprise: Remote desktop facepalm
Disable-NetAdapter is dangerous when you're logged in remotely, because if you disable the NIC you were using to connect, you won't be able to log back in again to re-enable the NIC. You know that, I know that, everybody knows that. But we still all make this mistake sooner or later. (My favorite variant of this story involves a remote kernel debugger and wayward flow control PAUSE frames taking the local network offline, killing the connection to the kernel debugger….)
Anyway, if you have to bounce the NICs, the safest solution is once again to use Restart-NetAdapter. That'll still kill your remote connection, but hopefully the NIC will come back up and the connection will be restored automatically.
WMI events
Smarter than polling
Suppose you want to know if a network adapter is connected. If you read our last WMI blog post, you're already clever enough to solve this handily: just query MSNdis_LinkState and execute the WmiQueryLinkState method. This is great if you need to poll the NIC for connectivity status — but what if you want to make better use of system resources by avoiding polling? Is it possible for event-driven code to be notified when the link state changes?
PowerShell 2.0 has great integration with WMI Events, letting you invoke a PowerShell script whenever an event is emitted. Even better, NDIS has built-in support for a couple dozen events that you can register for. These events are available on Windows XP and later (although PowerShell 2.0 needs to be installed separately). Here's a simple example:
PS > $Event = Register-WMIEvent -Namespace root\wmi -Class MSNdis_StatusMediaConnect -Action {
Write-Host $(Get-Date), $Event.SourceEventArgs.NewEvent.InstanceName
}
This command creates a PowerShell event, and wires it up to a WMI event. This event is triggered whenever an adapter sends up a Connected status indication (either NDIS_STATUS_MEDIA_CONNECT or NDIS_STATUS_LINK_STATE containing MediaConnectStateConnected). When the PowerShell event executes, it prints a timestamp and the adapter's Instance Name (aka, ifDescr) to the console.
Now you have everything you need to write a script to send an alert email whenever the network cable gets unplugged*.
* Except for the trifling detail that email doesn't work so well while the network is unplugged.
WPP and KD
Industrial-strength tracing in an industrial-strength debugger
Last time we talked about controlling WPP from the command-line. This is great if you need to send instructions to a customer to collect logs, or if you want to automatically enable NDIS tracing on all your test machines. Because you don't need a debugger attached, the command-line approach is also the easiest.
As an alternative to the command-line, there is also a debugger extension that lets you control trace sessions entirely from within kd. And you don't need to be a kd-junkie to appreciate the value of this feature -- if a machine has already bugchecked, then this is the most reliable way to scrape NDIS's traces out of memory. (Even if you are logging to a file, the file might not have flushed to disk yet).
The key is the !wmitrace extension. Its documentation describes lots of cool tricks, including how to save traces to a file on disk, get messages printed to the debugger in real-time (like DbgPrint!), and change to a bigger buffer to avoid missing high-throughput traces. I'll let you read the docs on your own; the simplest usage looks like this:
0: kd> !wmitrace.start ndis
Break instruction exception - code 80000003 (first chance)
Remote operation finished with NTSTATUS 0x00000000
1: kd> !wmitrace.enable ndis {DD7A21E6-A651-46D4-B7C2-66543067B869} -level 4 -flag 0x31f3
Break instruction exception - code 80000003 (first chance)
Remote operation finished with NTSTATUS 0x00000000
0: kd> g
Now tracing is enabled. You can repro the bug or just leave the traces running continually in the background. (By default, they go to a circular buffer, so you'll always have access to the most recent few traces).
Later, when you want to dump the contents of the log, you'll need NDIS's TMF files. In this example, I have already uncompressed NDISTMF.ZIP into a directory on the local machine (the one running windbg) into C:\NDIS_TMF:
0: kd> !wmitrace.searchpath c:\ndis_tmf
Trace Format search path is: 'c:\ndis_tmf'
0: kd> !wmitrace.logdump ndis
(WmiTrace)LogDump for Logger Id 0x1d
Processing Global List: 4 Buffers
Total of 4 buffers found, now sorting entries
LOGGED MESSAGES (20):
[0]03C0.01EC::03/24/2011-00:41:32.009 [mp]==>NdisWriteErrorLogEntry: Miniport FFFFFA80064851A0, ErrorCode a004001b
[0]03C0.01EC::03/24/2011-00:41:32.009 [mp]<==NdisWriteErrorLogEntry: Miniport FFFFFA80064851A0, ErrorCode a004001b
[0]03C0.01EC::03/24/2011-00:41:32.009 [mp]==>ndisSwapFilterHandlers: Filter FFFFFA80069098E0, FakeStatus c023001f, Flags 2
[0]03C0.01EC::03/24/2011-00:41:32.009 [mp]<==ndisSwapFilterHandlers: Filter FFFFFA80069098E0
[0]03C0.01EC::03/24/2011-00:41:32.009 [mp]==>ndisSwapFilterHandlers: Filter FFFFFA8006906C90, FakeStatus c023001f, Flags 1
[0]03C0.01EC::03/24/2011-00:41:32.009 [mp]<==ndisSwapFilterHandlers: Filter FFFFFA8006906C90
[0]03C0.01EC::03/24/2011-00:41:32.009 [mp]==>ndisSwapFilterHandlers: Miniport FFFFFA80064851A0, FakeStatus c023001f, Flags 1
[0]03C0.01EC::03/24/2011-00:41:32.009 [mp]<==ndisSwapMiniportHandlers: Miniport FFFFFA80064851A0
[0]0004.003C::03/24/2011-00:41:32.035 [mp]==>ndisSwapFilterHandlers: Miniport FFFFFA80064031A0, FakeStatus c023001f, Flags 2
[0]0004.003C::03/24/2011-00:41:32.035 [mp]<==ndisSwapMiniportHandlers: Miniport FFFFFA80064031A0
[0]0000.0000::03/24/2011-00:41:36.441 [mp]==>NdisWriteErrorLogEntry: Miniport FFFFFA80064851A0, ErrorCode 60040020
[0]0000.0000::03/24/2011-00:41:36.441 [mp]<==NdisWriteErrorLogEntry: Miniport FFFFFA80064851A0, ErrorCode 60040020
[0]0000.0000::03/24/2011-00:41:36.441 [mp]==>ndisRestoreFilterHandlers: Filter FFFFFA80069098E0, Current fake status c023001f, Flags 2
[0]0000.0000::03/24/2011-00:41:36.441 [mp]<==ndisRestoreFilterHandlers: Filter FFFFFA80069098E0
[0]0000.0000::03/24/2011-00:41:36.441 [mp]==>ndisRestoreFilterHandlers: Filter FFFFFA8006906C90, Current fake status c023001f, Flags 1
[0]0000.0000::03/24/2011-00:41:36.441 [mp]<==ndisRestoreFilterHandlers: Filter FFFFFA8006906C90
[0]0000.0000::03/24/2011-00:41:36.441 [mp]==>ndisRestoreFilterHandlers: Miniport FFFFFA80064851A0, Current fake status c023001f, Flags 1
[0]0000.0000::03/24/2011-00:41:36.441 [mp]<==ndisRestoreMiniportHandlers: Miniport FFFFFA80064851A0
[1]025C.0CB8::03/24/2011-00:41:39.012 [mp]==>ndisHandleLegacyTransport: pDevice FFFFF8800A28F900
[1]025C.0CB8::03/24/2011-00:41:39.012 [mp]<==ndisHandleLegacyTransport
Total of 20 Messages from 4 Buffers
As you see, the last 20 messages are displayed, although you can go back a little further than that with the -t parameter to !wmitrace.logdump.
Finally, you can disable tracing with this:
0: kd> !wmitrace.stop ndis
Break instruction exception - code 80000003 (first chance)
Remote operation finished with NTSTATUS 0x00000000
Azure Automation Webhook parameter passing
Hi All,
Recently I was exploring the use of webhooks & needed to troubleshoot the parameters being passed to a webhook.
With the theme of my blog - hoping to save someone some time, this is a quick post to save someone creating this from scratch.
This is the Azure Automation PowerShell runbook that I used to display what was being passed to the webhook:
param ( [object]$WebhookData ) # If runbook was called from Webhook, WebhookData will not be null. if ($WebhookData -ne $null) { $webhookbody = convertfrom-json $webhookdata.RequestBody $webhookbody.context.timestamp | write-output $webhookbody.context.event.OperationName | write-output $webhookbody.context.resourceId | write-output $webhookbody.context | write-output $webhookbody | write-output }
As usual for any of my blog posts – if you have any feedback about any of the above, please provide it – that's how I learn.
Create VMM template for Ubuntu 16.04
There seems to be a lot of guidance - but none of it was clear enough for me.. these are my quick notes - sorry for any typo's / mistakes
- Download Ubuntu 16.04 ISO
- Create & boot a Gen 2 VM using this ISO & a blank disk
- Follow wizard (force UEFI disks if using Gen2 VM, and I didn't encrypt the disks, and be sure to install the "OpenSSH Server") - I suggest a generic username & password - as the one used here appears to still be there after VMM template is deployed.
- After deployment, wait for VM to boot & get it's IP address by logging into the VM & running 'ifconfig'.
Cd "C:\Program Files\Microsoft System Center 2016\Virtual Machine Manager\agents\Linux" c:\program files\putty\PSCP.exe *.* username@VmIp:
- the ':' after the IP is important - specifies the location to copy the files to. without anything after the ':' it will copy it to the users' home folder
- Then from VM:
# Update with latest security & other updates sudo apt-get update && sudo apt upgrade # enable automatic upgrades sudo apt install unattended-upgrades cat > 20auto-upgrades << EOF APT::Periodic::Update-Package-Lists "1"; APT::Periodic::Download-Upgradeable-Packages "1"; APT::Periodic::AutocleanInterval "7"; APT::Periodic::Unattended-Upgrade "1"; EOF sudo mv ./20auto-upgrades /etc/apt/apt.conf.d/ # install VMM agent chmod +x install sudo ./install ./scvmmguestagent.1.0.2.1075.x64.tar # UEFI fix (needed for Gen 2 VMs) sudo grub-install --target=x86_64-efi --efi-directory=/boot/efi --no-nvram --removable # install & enabled Hyper-V Integration components sudo apt-get update && sudo apt-get install linux-tools-$(uname -r) linux-cloud-tools-$(uname -r) -y hv_fcopy_daemon hv_kvp_daemon hv_set_ifconfig hv_vss_daemon hv_get_dns_info # shutdown VM for VHD image. (this is also needed for IC's to start working) sudo shutdown -h now
- Next copy VHD to VMM library
- Set VHD OS type to Ubuntu 16.04 (64 bit)
- Create VM template
- Make sure secure boot is disabled & VM Generation matches that used above.
The above steps didn't work for me when using Ubuntu 17.04
Getting a private certificate from Key Vault
Getting a certificate from key vault using PowerShell – while it isn't obvious also isn't hard. I'm putting this sample code here for me to use as a reference – but feel free to use & adjust it as you want.
A few key points first about certificates in Key Vault.
- BYO certificates when loaded into key vault are added using the *AzureKeyVaultCertificate* powershell cmdlets.
- Key Vault can generate self-signed certificates using the New-AzureKeyVaultCertificatePolicy cmdlet with '-IssuerName Self' and the Add-AzureKeyVaultCertificate cmdlet
- Private Certificates can then be accessed using the Get-AzureKeyVaultSecret cmdlet
- Public Certificates can then be accessed using the Get-AzureKeyVaultKey cmdlet.
- Access to run each cmdlet is governed through a range of access policies. E.g. 'Get' rights on 'secret' objects lets you get a secret (e.g. by running Get-AzureKeyVaultSecret with '-name'), and 'List' rights on 'key' objects lets you list the keys (e.g. by running Get-AzureKeyVaultKey without '-name').
- the below script assumes that you have authenticated to Key Vault and have permissions for the get operation.
anyway.. some code to get private certificates and make them available for a few difference purposes (the main point of this post):
#get Secret object (Containing private key) from Key Vault $AzureKeyVaultSecret=Get-AzureKeyVaultSecret -VaultName $VaultName -Name $CertificateName -ErrorAction SilentlyContinue #Convert private cert to bytes $PrivateCertKVBytes = [System.Convert]::FromBase64String($AzureKeyVaultSecret.SecretValueText) #Convert Bytes to Certificate (flagged as exportable & retaining private key) #possible flags: https://msdn.microsoft.com/en-us/library/system.security.cryptography.x509certificates.x509keystorageflags(v=vs.110).aspx $certObject = New-Object System.Security.Cryptography.X509Certificates.X509Certificate2 -argumentlist $PrivateCertKVBytes,$null, "Exportable, PersistKeySet" #Optional: import certificate to current user Certificate store $Certificatestore = New-Object System.Security.Cryptography.X509Certificates.X509Store -argumentlist "My","Currentuser" $Certificatestore.open("readWrite") $Certificatestore.Add($certObject) $Certificatestore.Close() #if private certificate needs to be exported, then it needs a password - create Temporary Random Password for certificate $PasswordLength=20 $ascii = 33..126 | %{[char][byte]$_} $CertificatePfxPassword = $(0..$passwordLength | %{$ascii | get-random}) -join "" #Encrypt private Certificate using password (required if exporting to file or memory for use in ARM template) $protectedCertificateBytes = $certObject.Export([System.Security.Cryptography.X509Certificates.X509ContentType]::Pkcs12, $CertificatePfxPassword) Write-output "Private Certificate Password: '$CertificatePfxPassword'" #Optional: Export encrypted certificate to Base 64 String in memory (for use in ARM templates / other): $InternetPfxCertdata = [System.Convert]::ToBase64String($protectedCertificateBytes) #Optional: Export encrypted certificate to file on desktop: $pfxPath = '{0}\{1}.pfx' -f [Environment]::GetFolderPath("Desktop") ,$CertificateName [System.IO.File]::WriteAllBytes($pfxPath, $protectedCertificateBytes)
While the above example is for getting a private certificate, getting a public certificate is similar & simpler. (use Get-AzureKeyVaultKey instead / a slight change to the flags if importing it locally / no need to encrypt if exporting to a .CER file).
As always – please let me know if you have any questions or comments – that's how I learn.
Hyper-V Performance - CPU
Hi - I'm Nick Eales from the Microsoft Premier Field Engineering team, based in Sydney Australia.
I frequently get asked by both Microsoft people as well as customers how to monitor Hyper-V. This generally really means that people want specific performance counters and thresholds - and these are not easily found in any form of consolidated list - which is what I hope to provide (across a few blog entries). I also aim to provide what each counter means (in real world terms), and what to do / look at to figure out why it exceeds the thresholds.
A word of caution - I have provided values that are what I initially use when reviewing a customer environment. The thresholds often need to be varied based on hardware and requirements. These starting values are based on experience at large numbers of customer environments worldwide (by my colleagues & I), while reviewing and troubleshooting Hyper-V.
My focus when choosing these counters and values is what will change the "feel" and "responsiveness" of the virtual machines running on these servers. If these are met, then throughput will usually look after itself.
There are four typical areas that you monitor in any server environment - CPU, Disk, Memory and Network. Hyper-V is no different - although the counters used to measure these a Hyper-V environment are often totally different to a standard server.
This post is going to focus on the CPU Performance counters - since they generate the most confusion. Later posts will address the other areas.
Physical CPU utilization
- Counter: Hyper-V Hypervisor Logical Processor(*)\%Total Run Time.
- Threshold: (any instance) > 50% sustained for > 5 min)
- What to do if threshold is exceeded:
- If _Total meets this, identify sources of CPU load (sounds obvious but.. )
- If single / small % of CPUs consistently affected, especially (but not necessarily) CPU 0 look for VMQ / RSS config issues, or other hardware issue.
- If a small number of CPUs are impacted, but the busy CPU does vary, then check the two "% Guest Run Time" processor counters below.
Management operating system CPU usage.
- Counter: Hyper-V Hypervisor Root Virtual Processor(_Total)\% Guest Run Time.
- Threshold (_Total instance) > 5% sustained for > 5 min
- What: This measures the amount of physical CPU time spent running Hyper-V host OS virtual CPUs.
- Why: The host OS doesn't compete for CPU time in Hyper-V. It always immediately gets any CPU time it needs, which is necessary to provide great performance for virtual machines. This means any unnecessary CPU usage in the host OS can have a significant negative performance impact on all virtual machines - which is why the guidance is to install as little as possible on the host OS (absolute minimum of agents, services & applications).
- What to do if threshold is exceeded:
- Check for any non-default OS running services / agents / processes in this OS, and review if they are really necessary.
- Check VMQ/RSS configuration (if 10GB NICs are in use) and for bad drivers - especially if this the CPU usage is focused on a small percentage of the hosts OS's VPs.
- Standard CPU performance troubleshooting - as if it was a physical machine.
- For general administration, use remote management tools instead of locally or via RDP on the host.
Virtual Machine Processor Usage
- Counter: Hyper-V Hypervisor Virtual Processor(*)\% Guest Run Time.
- Threshold (any instance) > 75%, sustained for > 10min
- What: This measures the amount of physical CPU time each VM virtual CPU instance uses. Each virtual processor can only run on one physical CPU thread at a time.
- Why: Unlike the Processor performance object and task manager inside a virtual machine, this accurately shows how much physical CPU time is being consumed by each VP.
- What to do if threshold is exceeded:
- Check VMs have sufficient VP (consider adding one of more processors to the VM)
- Perform standard high CPU usage troubleshooting inside the VM as you would if it was a physical machine to reduce the CPU usage within the VM.
Physical CPU Context Switching
- What: This measures the rate (number of times per second) each logical CPU changes what virtual processor it is running.
- Counter: Hyper-V Hypervisor Logical Processor(*)\Context Switches/sec.
- Threshold: (any instance except for "_Total") > 20000, (sustained for > 5min).
- Why: We use this as a general health & performance indicator for the host & virtual machines. This counter must be used in context with all other activity based counters (CPU, Disk & Network, latency & throughput).
- What to do if threshold is exceeded:
- Check VM config (particularly remove / disable any active & busy emulated devices)
- Check that the VM is using the correct version of the integration components.
- Check host operating system utilization Root VP CPU usage (host OS utilization) - see the "Hyper-V Hypervisor Root Virtual Processor" counter section for the specifics.
- Check drivers - particularly network and storage drivers, but other too.
- Check for significant inconsistency across your hosts - it can indicate significant configuration or load differences.
In a Hyper-V environment, please try to avoid using "Processor\% Processor Time" - for Hyper-V this does not measure physical CPU usage. This counter measures the amount of time the CPU is not idle within a specific operating system's view - and the timer that it uses for this calculation is dependent on exclusive use of the CPU - which is not the case in a Hyper-V environment. For similar reasons, please do not use "Processor\Processor Queue Length".
As usual for any of my blog posts - if you have any feedback about any of the above, please provide it - that's how I learn.
Hyper-V Performance – Memory
This is a continuation of a series on Hyper-V performance monitoring. The previous posts covered CPU and storage performance, This post is on Memory performance, and the remaining post will cover network performance.
Memory performance in Hyper-V environments is a mix of availability, ensuring Virtual Machines have the memory they need, and NUMA memory usage.
Host Available Memory
- Counter: Hyper-V Dynamic Memory Balancer\Available Memory
- Why: This is the memory available for virtual machine usage on a Hyper-V host, while ensuring that there is sufficient memory available for Hardware and Hyper-V management.
- Threshold: < 2GB
- What to do if threshold is breached:
- Check for many VMs with memory pressure < 60%, if so, reduce min memory
- Check for static memory assignment VMs that have been assigned more than needed (DM candidates?)
- Check Dynamic Memory is responding on virtual machines enabled for Dynamic Memory (a value for the "Average Pressure" value provides that).
- Reduce memory usage on hosts (load balance VMs between hosts?)
Virtual Machine Memory Pressure
- Counter: Hyper-V Dynamic Memory VM(*)\Average Pressure
- Threshold: Any Instance > 85% sustained > 1 min. (Note this thresholds assumes the default buffer setting of 20% - adjust this threshold on a per virtual machine basis if the buffer value is modified)
- Why: This displays the ratio of committed memory within the VM to the memory allocated to the virtual machine. This indicates whether the virtual machine has enough memory for its current needs, and values close to and over 100 indicate performance impacting page file use within the virtual machine. This value will be 0 if dynamic memory is disabled on Hyper-V 2012 R2 and earlier.
For virtual machines using dynamic memory, Hyper-V should maintain this at "100 / (100 + (100 * Memory Buffer))" (for default buffer for 20%, target pressure is 83.3%) - What to do if threshold is breached:
- Check each virtual machine's max memory settings (vs how much has been allocated to the virtual machine)
- Check overall host available memory
Virtual Machine Allocated Memory
- Counter: Hyper-V Dynamic Memory VM(*)\Physical Memory
- Threshold:
- no threshold (informational counter, used for capacity planning), or
- (optional) if dynamic memory is enabled, then > 90% of maximum memory. This is optional due the difficulty in implementing this with VMs of different maximum values.
- Why: This displays the current amount of allocated memory for each virtual machine (this value will reduce if dynamic memory reduces the memory allocated to virtual machines). The amount of memory shown within the virtual machine (either task manager or performance monitor counters) does not reduce when the memory is reduced (through dynamic memory), and so should not be used.
- What to do if threshold is breached (if one is used):
- identify if the dynamic memory maximum value for the virtual machine needs to be increased
- check the memory usage by the virtual machine is expected.
Remote NUMA Memory Node Access
- Counter: Hyper-V Vm Vid Partition(*)\Remote Physical Pages.
- Threshold: > 100 (and increasing by at least 100/hour). Note that this value will reset if the VM is restarted or migrated to a different host.
- Why: A Non-Uniform Memory Access (NUMA) node is a physical grouping of processors and memory (on a motherboard) for performance. Accessing memory on a remote NUMA node (on the same motherboard) is slower than accessing memory in the closest NUMA node for any type of CPU processing. A remote physical page access occurs when a virtual machine CPU core running on one physical processor accesses virtual machine memory on a remote NUMA node. Hyper-V does everything it can do to avoid this occurring by choosing which processors and sections of physical memory to allocate to virtual machines, however some configurations or levels of load can cause this to occur.
- What to do if threshold is breached:
- Use NUMA aware applications in virtual machines with large amounts of memory.
- Reduce the memory load on the host machine (if live migrating VMs away, prefer any VMs with this issue).
- If one virtual machine is primarily impacted (and performance is less than expected / desired), perform an action that results in that machines physical memory being reallocated to somewhere where there is sufficient memory available for the virtual machine's memory and NUMA configuration. These actions may be live migrate that VM to a different host or power off & power on that VM.
- Avoid using dynamic memory for large memory virtual machines (> 16 GB). Virtual machines with dynamic memory enabled present a single NUMA node to virtual machines (Hyper-V servers running 2012 R2 or earlier). This may or may not impact the performance of the virtual machine.
As usual for any of my blog posts - if you have any feedback about any of the above, please provide it - that's how I learn.
Hyper-V Performance - Networking
This is a continuation of a series on Hyper-V performance monitoring. The previous posts covered CPU, Storage and Memory performance, This post is on network performance.
Network monitoring in a Hyper-V environment depends very heavily on the configuration in use, the available hardware (speed of NIC) and the configuration in use.
Physical network adapter throughput
Counter: Network Interface\Bytes Total/sec
Why: This show how busy each physical NIC is.
Threshold: 90% of Network hardware speed (both NIC and connected switch)
What to do if threshold is met or exceeded:
- Ensure that you are applying weights to the network traffic to prioritize traffic types in this order (there are several methods to apply these weights - depending on the network config, and this all changes for Win2016):
- Host Management,
- CSV storage (Win2012 R2 and earlier)
- VM storage
- Live Migration (if using dynamic optimization or some other automatic load balancing method - otherwise put this last)
- VM traffic
- If the prioritization has already occurred, and any suboptimal performance is occurring, then either:
- increase capacity (more / faster NICs & switches)
- Reduce load by shifting workloads to other hosts
Virtual Machine Network throughput
Counter: Hyper-V Virtual Network Adapter\Bytes/sec
Why: This shows the network throughput for each VM Network adapter. This can be used for capacity planning and for load tracking purposes.
Threshold: This depends on the type of environment (most environments won't use a threshold, but will keep it for capacity planning)
I'm sure there are more counters that are relevant - if you have suggestions, please let me know (if they are storage related, please check that post first).
As usual for any of my blog posts – if you have any feedback about any of the above, please provide it – that's how I learn
Hyper-V Performance - Storage
This is a continuation of a series on Hyper-V performance monitoring. The previous post covered CPU performance, This post is on storage performance, and the remaining posts will cover memory and network.
Storage performance is often the most impactful on the performance and responsiveness of Hyper-V virtual machines.
Disk Latency of the virtual machine storage from the host.
- Why: Latency to the Virtual Machine data from Hyper-V is the most common cause of non-optimal virtual machine performance. It significantly helps to know what the normal range is in an specific environment before troubleshooting. This is the first (and for performance – the most important) storage counter to look at.
- Counters:
- For CSV Disks containing virtual machine data:
- Cluster CSV File System(*)\Read Latency
- Cluster CSV File System(*)\Write Latency
- For both CSV or SMB Storage:
- SMB Client Shares(*)\Avg. sec/Data Request (only shares containing virtual machine data)
- When local storage used for VMs (typically non-highly available virtual machines)
- Logical Disk(*)\Avg. Disk sec/Transfer (only instances containing virtual machine data)
- Threshold (for all of the disk latency thresholds): 0.015 (15ms) is a general threshold, but this will vary - Client virtualization may have higher thresholds (25ms), and server virtualization may have lower thresholds (often 8ms or lower).
- What to do if threshold is exceeded:
- For non-local storage:
- Check connection to storage - everything from storage adapters (NIC or FC) to the physical disks, inclusive.
- Check storage unit load & latency issues
- Check storage adapter driver & settings (including any load balancing or multipath configuration)
- Check storage unit and storage path load (both MB/Sec and IOPS) vs baseline numbers.
- For local storage
- Check local machine CPU (look for any single cores running 100%), and disk idle time
Disk Idle Time
- Why: This counter provides a clear measurement of what percentage of time the disk remained in idle state, meaning all the requests from the operating system to the disk have been completed and there is zero pending requests. Disk performance (and virtual machine responsiveness) will usually degrade significantly soon after this threshold is reached.
- Counter: Logical Disk(*)\% Idle Time (any instance)
- Threshold: < 50% , sustained > 5 min
- What to do if threshold is exceeded:
- Check storage unit load & latency issues
- Check storage adapter driver & settings (including any load balancing or multipath configuration
- Check storage load (MB/Sec and IOPS) vs baseline numbers.
- Identify busy virtual machine virtual disks (see "Hyper-V Virtual Storage Device\Normalized Throughput" in this post), and consider redistributing the busy virtual machine virtual disks.
Disk Space
- Why: It is very important to track disks running low on space. When the available space drive containing virtual machine storage falls too low, any operation that involves using more disk space will cause the virtual machine to have an outage and will show a status of "Paused-Critical" (visible in Hyper-V manager). The threshold chosen here should give ample warning before this outage occurs.
- Counter: LogicalDisk(*)\Free Megabytes (any instance other than "_Total" or "C:")
- Threshold: < 200GB (or whatever threshold is appropriate)
- the value should depend on disk capacity, expected growth, file system type, backup technology and size of regular fluctuations. Suggested values range from 5% (>10TB disks) to 15 % (<1TB disks).
- If the underlying storage is thinly provisioned, this threshold should generally be 15%.
- This counter won't show data for remotely accessed SMB storage.
- What to do if threshold is exceeded:
- Check for snapshots, differencing disks, Hyper-V Replica's (especially initial sync on targets), dynamic disks
Storage MB/sec
- Why: The host counters can be useful information when troubleshooting disk latency and idle time issues. For any shared storage where performance issues are being seen by any device accessing the storage, it is important to identify which host (or combination of hosts) is generating the load. Once the host has been identified, use the virtual machine counters to identify which virtual machine is generating the traffic. If it is an application or service on the host OS, stop it then contact the vendor for a fix or uninstall it - our purpose here is running virtual machines securely, fast and reliably - anything that interferes needs to be carefully evaluated.
- Threshold: no threshold - use this for getting a baseline and for capacity planning.
- Counters (Host):
- For CSV Disks containing VM data:
- Cluster CSV File System(*)\IO Read Bytes/sec
- Cluster CSV File System(*)\IO Write Bytes/sec
- For both CSV or SMB Storage:
- SMB Client Shares(*)\Data Bytes/sec (Read Bytes/sec or Write Bytes/sec)
- When local storage used for virtual machines (typically non-highly available virtual machines)
- LogicalDisk(*)\Disk Bytes/sec
- Counters (VM):
- Which virtual machines are generating most storage traffic
- Hyper-V Virtual Storage Device(*)\Read Bytes/sec
- Hyper-V Virtual Storage Device(*)\Write Bytes/sec
IOPS(or equivalent):
- Why: This can be useful information when troubleshooting disk latency and idle time issues. For any shared storage where performance issues are being seen by any device accessing the storage, it is important to identify which host (or combination of hosts) is generating the load. Storage teams also like to use these numbers for comparison purposes.
- Threshold: no threshold - use this for getting a baseline and for capacity planning.
- Counter (Host):
- For CSV Disks containing VM data:
- Cluster CSV File System(*)\IO Reads/sec
- Cluster CSV File System(*)\IO Writes/sec
- For both CSV or SMB Storage:
- SMB Client Shares(*)\Data Requests/sec (Read Requests/sec / Write Requests/sec)
- When local storage used for virtual machines (typically non-highly available virtual machines)
- LogicalDisk(*)\Disk Transfers/sec
- Counters (VM):
- Which virtual machines are generating most storage traffic
- Hyper-V Virtual Storage Device(*)\Read Operations/sec
- Hyper-V Virtual Storage Device(*)\Write Operations/sec
As usual for any of my blog posts – if you have any feedback about any of the above, please provide it – that's how I learn.
Install highly available SCVMM 2016 using SQL Always On
One of my customers recently had a frustrating time installing a VMM 2016 in a highly available configuration when using SQL Always on for the database. A standalone install into a highly available virtual machine does not meet their requirements. Due to the frustrations with getting this to work, I am sharing the steps we used.
Assumptions:
- Operating systems are already installed on at least four machines (SqlNode1, SqlNode2, VmmNode1, VmmNode2)
- Failover Clustering is configured so that SqlNode1 and SqlNode2 are in one cluster and VmmNode1 and VmmNode2 are in a different cluster.
- SQL Enterprise is installed and configured with always on capability enabled and a listener configured (SqlFMList). In our case, the listener was configured to listen on port 1771. SQL must be using port 1433 for a non-always on instance / database for this to work
The installation steps we used
- Create the VMMService account (eg svc_vmmservice), and grant it permissions to
- SQL on SqlNode1
- Local administrator group on VmmNode1 and VmmNode2
- Install VMM on VmmNode1. When you get to the SQL configuration section, give the computer name SqlNode1, port 1433, and allow it to create the database (VirtualManagerDB). Note down the location of the DKM.
- Uninstall VMM, choosing the option to retain the database.
- Ensure the svc_vmmservice account has a db_owner permissions of the VMM database.
- Ensure the SQL Listener / AG is active on the node that has the Database, but do not add the database to the Always On group yet.
- Use the below ini file to install VMM on one VMM node at a time - (we couldn't get this to work using the graphical installer due to the SQL port required and issues with the user interface). This will install VMM so that when launching the console, connect to the address "vmm:8100"
[OPTIONS] ProductKey=XXXXXXXXXXXX UserName=Name CompanyName=Name ProgramFiles=C:\Program Files\Microsoft System Center 2016\Virtual Machine Manager CreateNewSqlDatabase=0 SqlDatabaseName=VirtualManagerDB SqlServerPort=1771 RemoteDatabaseImpersonation=0 SqlMachineName=SqlFMList IndigoTcpPort=8100 IndigoHTTPSPort=8101 IndigoNETTCPPort=8102 IndigoHTTPPort=8103 WSManTcpPort=5985 BitsTcpPort=443 #CreateNewLibraryShare=1 #LibraryShareName=MSSCVMMLibrary #LibrarySharePath=D:\VMMLIB\ #LibraryShareDescription=Virtual Machine Manager Library Files SQMOptIn = 0 MUOptIn = 0 VmmServiceLocalAccount = 0 TopContainerName="CN=DKM,DC=LAB,DC=INTRANET" #replace this with the DKM location HighlyAvailable = 1 VmmServerName=VMM VMMStaticIPAddress=10.51.83.236 Upgrade=0
The command line used to use this INI file is:
setup.exe /server /i /f <IniFilePath> /VmmServiceDomain <Domain> /VmmServiceUserName <Service Account> /VmmServiceUserPassword <Service account PW> /IACCEPTSCEULA
- After installation of VMM on both nodes, check the VMM console can connect to the server
- Using cluster manager take the VMM service offline
- Add the SQL database to the AG with the listener used in the above file (SqlFMList).
- Restart VMM. Check that VMM works with different combinations of which node VMM & SQL are on.
The "Upgrade" setting in the ini file - is set to zero because in the initial installation to create the database, my customer also applied UR4. By default the installation appears to try to "upgrade" the database version if the versions don't match the expected version (2016 RTM) - since we were using a newer version, we had to tell it not to upgrade it.
OAuth using PowerShell and certificate Service Principal to Azure Function App
Hi,
Recently I needed a way to write PowerShell code to use a certificate backed service principal to use OAuth authentication when calling a web hook. This took longer than it should to figure out (my colleague Arian helped a lot), so I figured I may be able to save someone else some time by sharing this online.
For the application you are sending the authenticated web hook to, modify the Authorization settings under "Platform features":

Enable App Service Authentication, choose AD Auth, and configure the AD Auth setting

Set the following values (sources provided later):
![clip_image001[6]](https://msdntnarchive.blob.core.windows.net/media/2017/06/clip_image0016_thumb.png "clip_image001[6]")
Value 3 is the tenant ID:

Values 2 & 4 come from the App Registrations in Azure AD for the Service Principal (these can also be queried via PowerShell if needed (Get-AzureADServicePrincipal)

This is some sample code used to call the webhook & pass some parameters to it, and show the output:
function Get-AuthHeaderUsingCert { param( $TenantID, $CertificateThumbprint, $ApplicationIdURL, $ApplicationId ) $AuthUri = "https://login.windows.net/$TenantID/oauth2/authorize" $clientCertificate = Get-Item -Path Cert:\CurrentUser\My\$CertificateThumbprint $authenticationContext = New-Object -TypeName Microsoft.IdentityModel.Clients.ActiveDirectory.AuthenticationContext -ArgumentList $AuthUri $certificateCredential = New-Object -TypeName Microsoft.IdentityModel.Clients.ActiveDirectory.ClientAssertionCertificate -ArgumentList ($ApplicationId, $clientCertificate) $authToken = $authenticationContext.AcquireTokenAsync($ApplicationIdURL, $certificateCredential) $authHeader = @{ 'Content-Type'='application/json' 'Authorization'=$authToken.result.CreateAuthorizationHeader() } $authHeader } add-type -path C:\Temp\Microsoft.IdentityModel.Clients.ActiveDirectory.dll #I'm using Version 2.28.31117.1411 of this DLL - Apparently newer ones don't work for this. $AuthHeader = Get-AuthHeaderUsingCert -TenantID $tenantID -CertificateThumbprint $CertificateThumbprint -ApplicationId $ApplicationId -ApplicationIdURL $ApplicationIdURL if([string]::IsNullOrWhiteSpace($authheader)){throw "no auth"} $JSONArguments = $(@{'ArgName'='ArgValue'} | convertto-json -Depth 5) $Result = Invoke-Webrequest -Uri $WebhookURL -Headers $AuthHeader -Body $JSONArguments -Method Post $result
Popular posts from this blog
AD RMS to AD RMS to Azure Information Protection Part 1 The Scenario: So, you have read my previous blog posts about AD RMS side-by-side migration and Enterprise Migration from AD RMS to AIP using SCCM but unfortunately both of those articles assume best case scenario for the original AD RMS cluster. Sadly, that is not always the way things work. In the real world, the AD RMS instance may have been initially installed on Windows Server 2003 using RMS 1.0 and was subsequently upgraded to 2008 R2 keeping all of the settings pretty much the same. This usually means using http only and having no CNAMEs for AD RMS or SQL. This makes my happy articles on upgrading to newer versions of AD RMS or to AIP a lot less straightforward. Let's fix that. The Setup: Luckily, most of the concepts for migration are the same as what I documented in the previous two articles, so I am going to happily plagerize reuse the content in those articles to make something new. This a
MEDC in Las Vegas
Windows Azure:新计划程序服务,读取访问同步冗余存储以及监测更新 [原文发表地址] Windows Azure: New Scheduler Service, Read-Access Geo Redundant Storage, and Monitoring Updates [原文发表时间] December 12, 2013 12:41 PM 今天早上我们推出了windows Azure的另一组增强功能。今天的新功能包括: 程序调度:新的windows Azure计划程序服务 存储:新的同步读写冗余存储方案 监测:windows Azure服务的监测及诊断的增强功能 所有的这些改进现在都可以使用(注意有些功能仍然是在预览)。下面是有关他们的更多详细信息: 程序调度:新的windows Azure计划程序服务 我很高兴宣布我们可以预览新的Windows Azure调度服务。Windows Azure调度服务允许你安排启用HTTP/S端点的任务或者按你制定的任何计划向存储队列上发送信息。使用调度程序,你可以创建可靠的调用Windows Azure内部或外部服务的任务并且按照常规计划立刻运行或者设置他们在未来某刻运行。 想要开始使用调度程序,首先你需要在 Windows Azure Preview 页面上为预览进行注册。一旦在预览页中注册成功后,你可以登陆到管理门户并且开始使用它。 创建一个调度任务 一旦你在你的订阅中启用调度预览,你可以用以下几个简短步骤很容易的创建一个新的任务。 在Windows Azure门户管理网站内单击 新建-> 服务程序 -> 调度 –> 自定义创建: 选择一个你想要运行任务的Windows Azure 区域,之后选择一个已有的任务收集器或者创建一个新的并把任务加进去: 之后你就能定义你的任务操作。在本例中,我们会创建一个向web站点发送GET 请求的HTTP 操作(你也可以使用其他的HTTP协议,像HTTPS)。 对于处理长时间的请求或者在脱机状态启用某项服务,你也许更期望给存储队列添加一些信息而不是坚持启用一个Web 服务。要给存储队列添加信息你只需要选择存储队列作为你的操作,之后创建或选择一个存储帐号及队列用来发送请求: 一旦你定义了你要
Exclude a path from WSS 3.0 on Windows Server 2008
Recursive CTEs continued ... In this post, I will finish the discussion of recursive CTEs that I began in my last post. I will continue to use the CTE examples from Books Online . To run these examples, you'll need to install the Adventure Works Cycles OLTP sample database . In my last post, I explained that all recursive queries follow the same pattern of one or more anchor sub-selects and one or more recursive sub-selects combined by a UNION ALL. Similarly, all recursive query plans also follow the same pattern which looks like so: |--Index Spool(WITH STACK) |--Concatenation |--Compute Scalar(DEFINE:([Expr10XX]=(0))) | |-- ... anchor sub-select plan(s) ... |--Assert(WHERE:(CASE WHEN [Expr10ZZ]>(100) THEN (0) ELSE NULL END)) |--Nested Loops(Inner Join, OUTER REFERENCES:([Expr10YY], [Recr10XX], ...)) |--Compute Scalar(DEFINE:([Expr10ZZ]=[Expr10YY]+(1)))


![clip_image001[6]](https://msdntnarchive.blob.core.windows.net/media/2017/06/clip_image00161.png "clip_image001[6]")


Comments
Post a Comment